To replace a monthly Excel report, don't start with dashboards. Start with the workbook itself: inventory every input cell, trace each one to a source system, and accept that a real share of it lives in no system at all. Then build crosswalks between systems, a pipeline that validates before it publishes, and a pilot that runs alongside the spreadsheet until the numbers tie. Retire the workbook only after that.
This playbook is the program we run for contractors. It comes from rebuilding real monthly reports, including an 11-tab progress workbook with about 700 hand-maintained input cells and a 44-sheet QA/QC workbook. It covers the steps, who you need, the mistakes that sink these projects, and what to ask anyone who offers to do it for you.
Why the monthly Excel report is so hard to kill
The monthly report usually starts as a convenience and turns into infrastructure. Someone exports from Procore, someone else exports from accounting, a project manager types in wins, risks and safety numbers, and a controller stitches it together. Each month the same work happens again, and each month the formulas get a little more fragile.
Three things make it hard to replace:
- It mixes systems that share no keys. Procore projects, accounting jobs, schedule activities and CRM deals each have their own IDs. The spreadsheet joins them by a person's memory.
- Part of it is not data from anywhere. Wins, risks, management attestations, client satisfaction and quality registers are typed in by hand. No API will ever return them.
- Its logic is invisible. Scoring rules, bands and adjustments live in cell formulas nobody has audited in years.
That last point matters more than it sounds. When we rebuilt one contractor's workbook and read every formula, we found two errors in its project scorecard. On the sample project they happened to offset each other, so the total looked right, while roughly 42% of the scorecard weighting was disconnected from actual project performance. Nobody could see it.
Key terms
- Source of truth: the one system that owns a given number. Cost to date might come from Procore, with accounting used only as a cross-check.
- Crosswalk: a mapping table that links the same thing across systems, such as a Procore project to an accounting job, or old cost codes to new ones.
- Medallion architecture: raw data lands as received (bronze), is typed and validated (silver), then modeled for reporting (gold).
- Quality gate: a set of automated checks that must pass before new numbers reach the report. If they fail, the previous good version stays live.
- Semantic model: the layer that defines measures and relationships so every report page computes "billed to date" the same way.
Where each part of the workbook should come from
Before you build anything, sort every tab and input into one of these buckets. In our Procore and Sage build, about 40% of the old workbook lived in no system at all.
| What the workbook holds | Typical example | Where it should come from | How it gets there |
|---|---|---|---|
| Project and contract data | Contract value, change orders, budgets, forecasts | Project management system (e.g. Procore) | API extract, nightly |
| Money | AR invoices, payments, AP job cost | Accounting (e.g. Sage 100 Contractor, QuickBooks Online) | Read-only SQL or API |
| Schedule | Critical milestones, percent complete | Scheduling system (e.g. Outbuild, Primavera P6) | API or file extract |
| Pipeline | Open deals, weighted pipeline | CRM (e.g. HubSpot) | API extract |
| Judgment and narrative | Wins, risks, profitability outlook, client survey | No system: people | Structured lists with validation and an audit trail |
| Rules | Scorecard weights and bands, cost-code maps | Your business, written down | Version-controlled reference tables |
The last two rows are where most projects stall. Teams assume "automation" means every number comes from an API, then discover a third of the report is human input with nowhere to live.
The playbook: nine steps from workbook to retirement
1. Inventory the workbook
Open every tab and list every input cell, formula, table and chart. Record who fills it in, when, and where they get the number. The rebuild we mentioned started from an inventory: 11 tabs, roughly 700 manually maintained input cells, 17 tables, one chart.
Output: a spreadsheet of inputs with owner, frequency and current source.
2. Map each input to a source
For every input, name the system of record and the field. Where two systems hold the same number, pick one as the source and the other as a cross-check. In our Procore and Sage build, Procore spend drives the report and Sage AP job cost is used only to reconcile it, never added to it.
Output: a source map, plus a list of fields with no source.
3. Find the part that lives in no system
Expect this to be a large share, as the table above shows. Do not leave it in Excel, and do not drop it. Move it into structured, validated input. We used 17 versioned SharePoint lists for monthly registers (wins, risks, attestations, baseline dates, client satisfaction) and quality registers (statutory gates, trade checklists, special inspections). A CSV drop works for a pilot, but it has no input validation; lists do, and they record who entered what.
Output: a designed input form for every manual field, with an owner and a due date.
4. Build the crosswalks
Decide how projects, cost codes and vendors match across systems. Our Procore, QuickBooks and HubSpot build applies three rules in order:
- The controller's manual mapping file wins.
- Exact match on the Procore project number in the accounting job name.
- A name match only when it is unambiguous: one candidate at high confidence.
Anything that doesn't match stays in the totals, flagged as unmapped. Refusing to guess matters more than matching everything. If you are moving to a new cost-code structure, the crosswalk is also where old codes map to new ones. In the Sage build we kept legacy, old-ERP and new codes in version-controlled tables with a measure of how much budget maps cleanly.
Output: crosswalk tables under version control, and an exceptions list.
5. Build the pipeline
Land raw data first, transform second. Our pattern in Microsoft Fabric:
- Bronze: raw API payloads with load stamps. A logic fix becomes a re-run, not a re-extract.
- Silver: typed and validated rows. Failures go to a rejects table with a reason.
- Gold: a star schema of facts and shared dimensions (project, date, cost code, vendor).
- Semantic model: measures defined once, served to Power BI through Direct Lake.
Keep the extract code driven by a registry of endpoints rather than one script per endpoint, so adding a source is configuration rather than a rewrite. We cover the full architecture in building construction reporting in Microsoft Fabric.
Output: a nightly pipeline that refreshes everything the workbook used to hold.
6. Put a quality gate before publish
The sequence is extract, validate, transform, validate, publish. The gate checks things like projects without a crosswalk entry, cost codes not in source, inverted milestone dates and unmatched invoices. A blocking failure stops the refresh, and yesterday's correct numbers stay in place. A stale answer beats a wrong one.
Design the gate to catch defects that look fine on screen. A column reference that silently returns zero, for example, can produce a WIP schedule that still satisfies every accounting identity (over billing minus under billing equals billed minus earned) while being wrong. Balanced is not the same as correct, so test values against the source, not just internal consistency. See construction data quality rules for the checks we start with.
Output: automated rules, a pipeline status on every page, and an unresolved-records worklist that names the system to fix each record in.
7. Pilot alongside the spreadsheet
Run one or two reporting months in parallel. Tie every headline number back to the workbook and the source systems. Where they differ, find out which one is wrong. Sometimes it is the new pipeline. Often it is the spreadsheet, as the scorecard bug showed.
Track coverage openly. In one walkthrough of our Procore and Sage build, the scorecard showed 59% coverage from the data pulled so far. In the production walkthrough it showed 71%, with the remaining 29% waiting on manual input through the SharePoint lists. Showing that number honestly is better than filling the gap with zeros.
Output: a signed-off reconciliation for the pilot months.
8. Roll out to the people who feed it
The report is only as good as its manual inputs. Train project managers on the input lists, set due dates, and show empty registers as "awaiting input" rather than zero. Give every page a short note on how to read it. Add drill-through so an executive can right-click a project and see the detail behind a number.
Output: owners entering data on schedule, and coverage climbing month over month.
9. Retire the spreadsheet
Once the pilot reconciles and inputs flow, freeze the workbook as read-only, archive it, and point everyone at the report. Start month-end snapshots from the first passing run so history is real rather than reconstructed. Earlier months should read as "unavailable", not zero.
Output: one report, no exports, and a dated archive of the old workbook.
Who you need on the team
| Role | What they own | Time commitment |
|---|---|---|
| Executive sponsor | Decides what the report is for, settles disputes over definitions | A few short reviews |
| Controller or finance lead | Source-of-truth decisions, crosswalk sign-off, reconciliation | Highest during steps 2, 4 and 7 |
| Project controls or ops lead | Schedule, safety and quality definitions, scorecard bands | Steps 2, 3 and 8 |
| Project managers | Manual inputs through the new lists | Monthly, after rollout |
| IT or systems admin | Credentials, read-only access, gateway, Key Vault | Early, mostly step 5 |
| Builder (in-house or partner) | Pipeline, model, report, quality rules | Throughout |
Access is usually the first bottleneck. Getting API credentials for Procore, read-only SQL access to accounting through a data gateway, and a place to store secrets often takes longer than writing the first extract.
Common mistakes
- Rebuilding the spreadsheet's layout instead of its purpose. Ask what decision each tab supports. Some tabs exist only because Excel needed them.
- Treating missing data as zero. A project missing from accounting does not error; it shows $0 revenue and $0 billing. Add a source-coverage check so an unintegrated project can't pass for an idle one.
- Guessing matches. A fuzzy match that is usually right still puts the rest into the wrong project's totals, silently.
- Summing running balances. Pay-application columns are running totals. Read retainage from each contract's latest issued or approved pay app, or you multiply it.
- Skipping the manual-input design. If the "no system" share has no home, people keep the spreadsheet, and you now have two reports.
- Publishing without a gate. One bad night of data in front of leadership costs more trust than a week of stale numbers.
- Hard-coding scoring rules. Put weights and bands in tables so management can retune them and the page can show the arithmetic.
What to ask a vendor or consultant
Whether you build in-house or hire someone, these questions separate a durable platform from a pretty dashboard:
- What happens when a source fails or returns bad data? You want a gate that blocks publishing and keeps the last good version, not a dashboard that shows whatever arrived.
- How do you match projects across systems, and what happens to the ones that don't match? Listen for "flagged, never dropped" and a manual override list.
- Where does the data that no system holds go? If the answer is "keep a spreadsheet," the spreadsheet isn't retired.
- Can I see the logic? Measures, quality rules, crosswalks and report definitions should be in version control, reviewable as diffs.
- Is access read-only and are credentials in a vault? Reporting should never need write access to your ERP.
- How will I know the numbers are complete? Ask for source coverage, data-quality and unresolved-records pages, not just KPIs.
- Who owns it after go-live? You should be able to run, change and hand over the platform without the vendor.
How we approach it
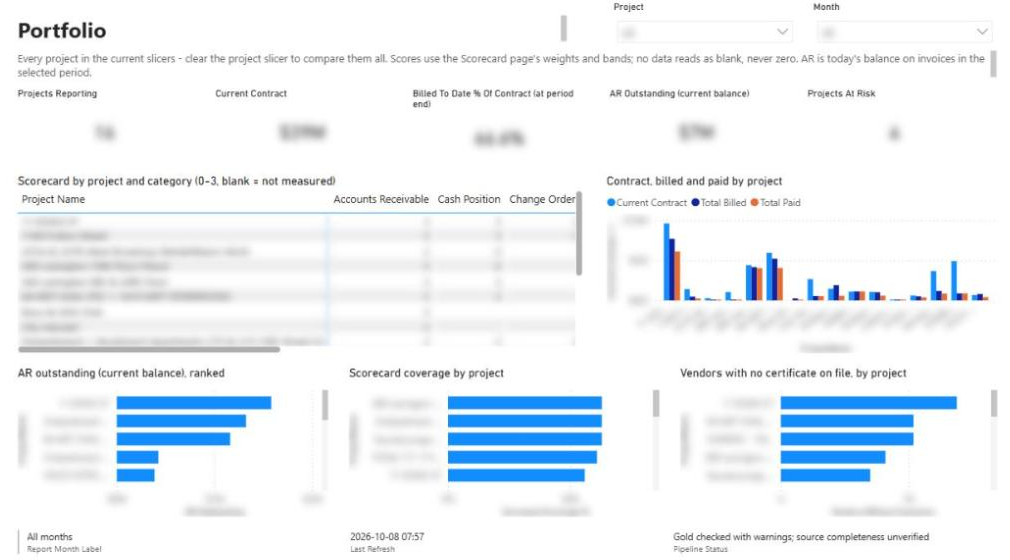
We have run this program end to end. For a general contractor on Procore, Sage 100 Contractor and Outbuild, we replaced the monthly progress workbook and the QA/QC workbook with two Power BI reports, 22 pages and about 180 measures, refreshed nightly through Microsoft Fabric with about 200 data-quality rules in front of them. The showcase walks through every page, and the video walkthrough shows the reports, the SharePoint input lists and the lakehouse underneath.
For contractors on cloud accounting, we built the same pattern on Procore, QuickBooks Online and HubSpot: a Power BI report covering WIP, backlog, AR, cash forecast, capacity and pipeline, with about 50 data-quality checks that run before every refresh. See the Procore, QuickBooks and HubSpot reporting example, and the WIP reporting guide if the WIP schedule is the report you most want off Excel.
A few principles carry across every build:
- Blank, never zero. Missing data shows as blank or "not measured".
- Flag, never drop. Every unmatched record lands on a worklist with the system to fix it in and the money it carries.
- Fix it at the source. Corrections happen in Procore or accounting, and the record drops off the worklist on the next run.
- Built as code. Pipelines, models, reports and rules deploy from version control, so you own them.
More on these in our approach.
Ready to retire yours?
If your team rebuilds the same workbook every month, we would be glad to look at it with you. Send us the tab list or walk us through it on a call. We will tell you honestly which parts can come from your systems, which need structured input, where the crosswalks will be hard, and what a sensible first pilot looks like. That conversation is useful whether or not you build with us.
Where to go next
- Watch the Procore, Sage and Outbuild reporting walkthrough to see a replaced monthly report in production.
- Read how we rebuilt a monthly construction report from Procore to Power BI for the step-by-step build story.
- Browse more playbooks for running projects like this one.
- Tell us about your monthly report and we will help you plan the first pilot.
Frequently asked questions
How do you replace a monthly Excel report with Power BI?
Inventory every input in the workbook, map each one to a source system, and move the data no system holds into structured input lists. Then build crosswalks between systems, a pipeline with a quality gate, and run the new report alongside the spreadsheet until the numbers reconcile before retiring the workbook.
What do you do with report data that isn't in Procore or accounting?
Give it a structured home with validation and an audit trail. We used versioned SharePoint lists for wins, risks, attestations, client satisfaction and quality registers, and the report shows empty registers as awaiting input rather than zero.
How do you match Procore projects to accounting jobs?
Use a crosswalk with rules applied in order: a controller-maintained manual mapping first, then an exact project-number match, then a name match only when there is a single, high-confidence candidate. Anything unmatched stays in the totals and is flagged for review.
How long should we run the old spreadsheet and the new report in parallel?
Long enough to reconcile every headline number for at least one full reporting cycle, and usually two. Differences should be investigated rather than explained away, because sometimes the spreadsheet is the one that is wrong.
Do we need Microsoft Fabric to automate construction reporting?
No single platform is required, but you need somewhere to land raw data, validate it and model it before Power BI reads it. We use Microsoft Fabric with a bronze, silver and gold lakehouse because it keeps raw data, quality rules and the semantic model in one governed place.
What should we ask a vendor before automating our monthly report?
Ask what happens when a source returns bad data, how unmatched projects are handled, where manual data will live, whether the logic is in version control, whether access is read-only, and who owns the platform after go-live.
Next step
Have a problem like this?
Tell us the outcome you need. We'll tell you honestly how we'd approach it, and reply within two business days.
Keep learning
Reporting & analytics · October 8, 2026
Construction Project Reporting: Solution Showcase
Two Power BI reports—22 pages and ~180 measures—that replaced a general contractor's hand-filled monthly progress and QA/QC workbooks. Computed nightly from Procore, Sage 100, Outbuild, and SharePoint, and published only after ~200 data-quality rules pass.
Reporting & analytics · August 3, 2026
Rebuilding a Construction Monthly Report: Procore to Power BI
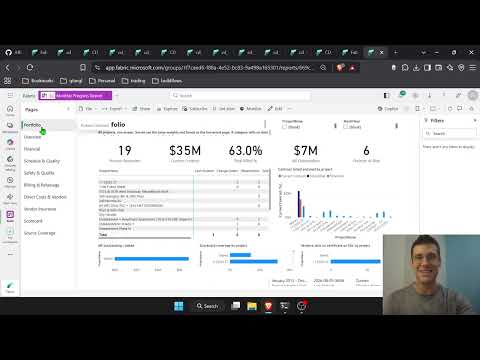
We replaced an 11-tab, 700-input-cell Excel workbook with an automated Procore, Sage and Fabric pipeline feeding 12 Power BI pages, and found two hidden scorecard bugs on the way.
Reporting & analytics · October 8, 2026
Construction Data Quality: The Rules That Make Reports Trustworthy
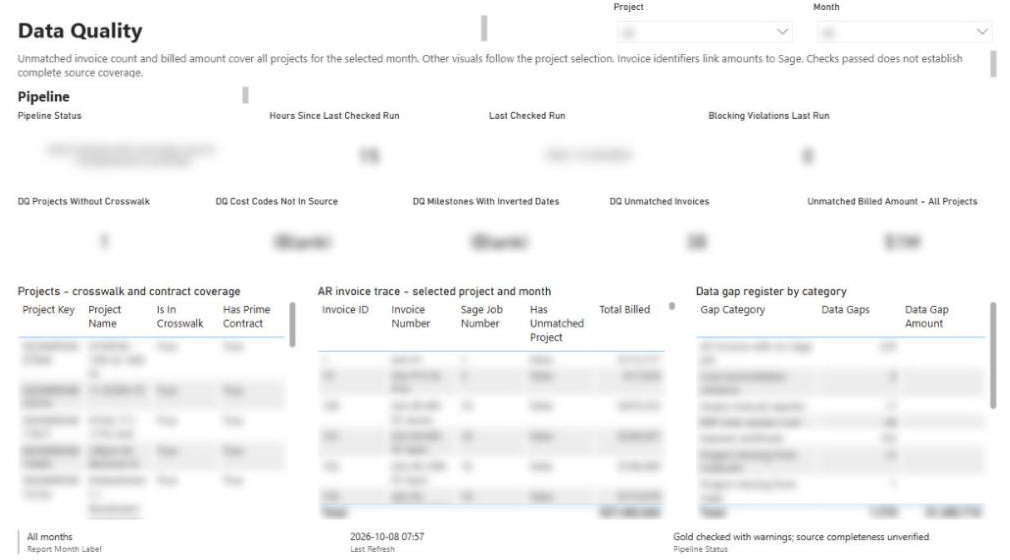
A practical checklist of the data-quality rules behind construction reports people can defend, from quality gates and blank-never-zero to cost-code crosswalks, reconciliation and snapshots.