At a glance: 4 source systems · 2 Power BI reports · 22 pages · ~180 measures · ~200 nightly data-quality rules · 0 hand-typed numbers.
We built a general contractor two Power BI reports, 22 pages and about 180 measures, that replace their hand-filled monthly progress workbook and QA/QC workbook. Every figure is computed nightly from Procore, Sage 100, Outbuild and SharePoint, and only published after automated data-quality checks pass. Screenshots below are from the live reports with client names, amounts and record details blurred.
Data sources and pipeline
Four source systems feed one governed data layer in Microsoft Fabric, which serves both reports. About 40% of the old workbook lived in no system at all, so we moved that into structured SharePoint lists with an audit trail.
| Source | Type | What it contributes |
|---|---|---|
| Procore (project management) | Cloud API, about 44 endpoints | Projects, vendors and prequalification, insurance certificates, budget lines (budget, forecast, committed, spent, cost to complete), prime contracts and change orders, commitments, direct costs, owner and subcontractor pay applications (the source of retainage), RFIs, submittals, observations, punch items, inspections, incidents, manpower hours, daily logs |
| Sage 100 Contractor (accounting) | On-premises SQL through a data gateway, 8 tables | AR invoices and payments (billed, paid, AR balance, days to payment), AP invoices (job cost used to reconcile Procore spend), jobs, vendors |
| Outbuild (scheduling) | Cloud API | Critical-path activities and milestones: start, finish, percent complete |
| SharePoint lists (manual input) | 17 versioned lists | Monthly registers: wins, risks, priority items, management attestations, baseline dates, client satisfaction survey, daily-log compliance, safety and quality monthly. Quality registers: statutory gates, trade checklist results, DFOW risk register, inspection and test plan, special inspections, inspector sign-ins, commissioning, health-department checks |
| Reference data (version controlled) | Seed files | Cost-code master and old-to-new code maps, Procore-to-Sage project crosswalk, scorecard weights and bands, quality-plan templates (trades, checklists, gate pathways) |
How the nightly pipeline works
- Land raw data (bronze). Each source is copied as received, with load stamps. Raw payloads are kept, so a logic fix is a re-run, not a re-extract.
- Clean and validate (silver). Rows are typed and checked. Any row that fails goes to a rejects table with a reason, never silently dropped.
- Model (gold). A star schema of facts (budget lines, invoices, billings, milestones, quality records) and shared dimensions (project, date, cost code, vendor), plus a data-gap register.
- Data-quality gate. About 200 automated rules run. Any blocking failure stops publication, so a bad night leaves yesterday's correct numbers in place.
- Snapshot. Point-in-time balances are saved on each passing run, which builds true month-end history.
- Publish. Two Direct Lake semantic models refresh only after the gate passes and feed the two reports.
Every report page footer shows the reporting month, the last refresh time and a plain-text pipeline status (passed, warnings, late, stale or blocked).
Report 1: Monthly Progress Report (13 pages)
This report replaces the leadership team's hand-filled monthly Excel progress workbook. Every page has Project and Month slicers, a short note on how to read it, and the pipeline-status footer. Status flags are text measures (for example "Spend over budget above 5%"), so they survive printing in greyscale.
Portfolio
Compares every project on finance, health score and compliance in one view.
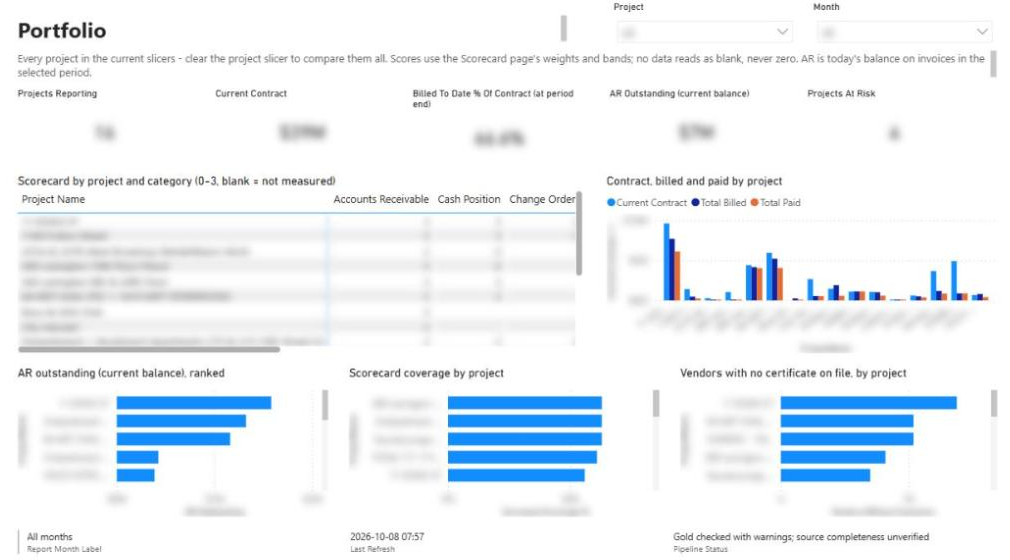
- KPIs: projects reporting, current contract, billed to date as % of contract, AR outstanding, projects at risk.
- Visuals: scorecard heat map (project × category, 0–3), contract vs billed vs paid by project, AR outstanding ranked, scorecard coverage by project, vendors with no insurance certificate by project.
- Logic: a project is "at risk" when its measured-only scorecard is below 0.6.
Overview
The headline dashboard that replaces the workbook's front tab.
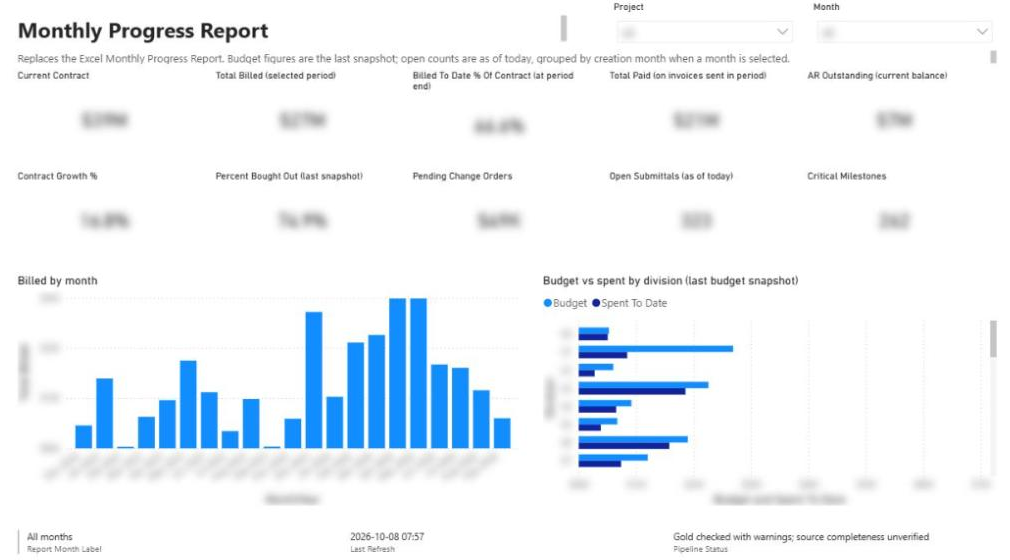
- KPIs: current contract, total billed (period), billed % of contract, total paid, AR outstanding, contract growth %, percent bought out, pending change orders, open submittals, critical milestones.
- Visuals: billed by month; budget vs spent by cost-code division.
Financial
Budget health by cost code, change orders and the billing S-curve.
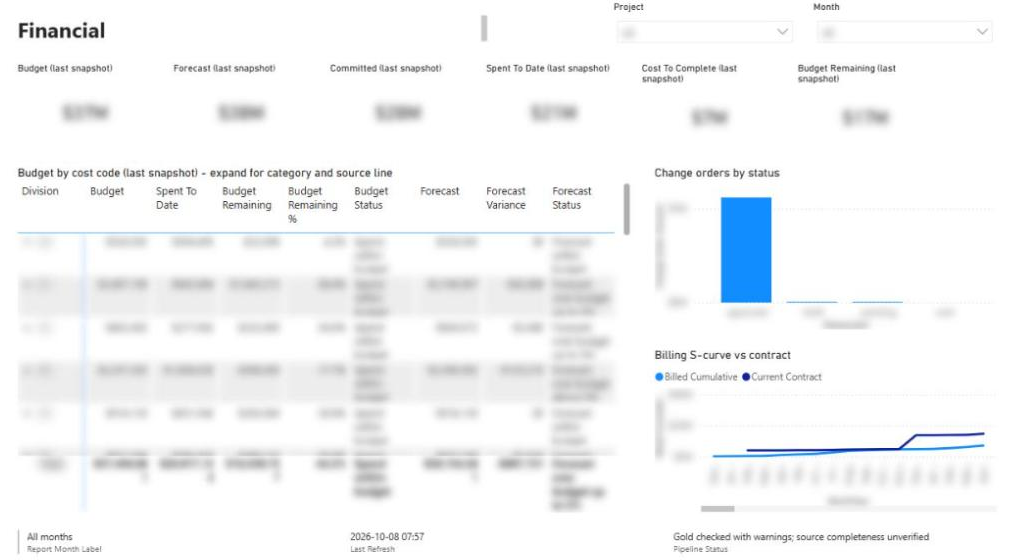
- KPIs: budget, forecast, committed, spent to date, cost to complete, budget remaining (all from the latest budget snapshot).
- Visuals: budget matrix that drills from division to cost code to budget line, with budget remaining %, forecast variance and status flags; change orders by status; billing S-curve against contract value.
- Logic: budget and forecast status are three bands: within budget, over by up to 5%, over by more than 5%.
Schedule & Quality
Critical-path milestones from the scheduling system and the submittal backlog.
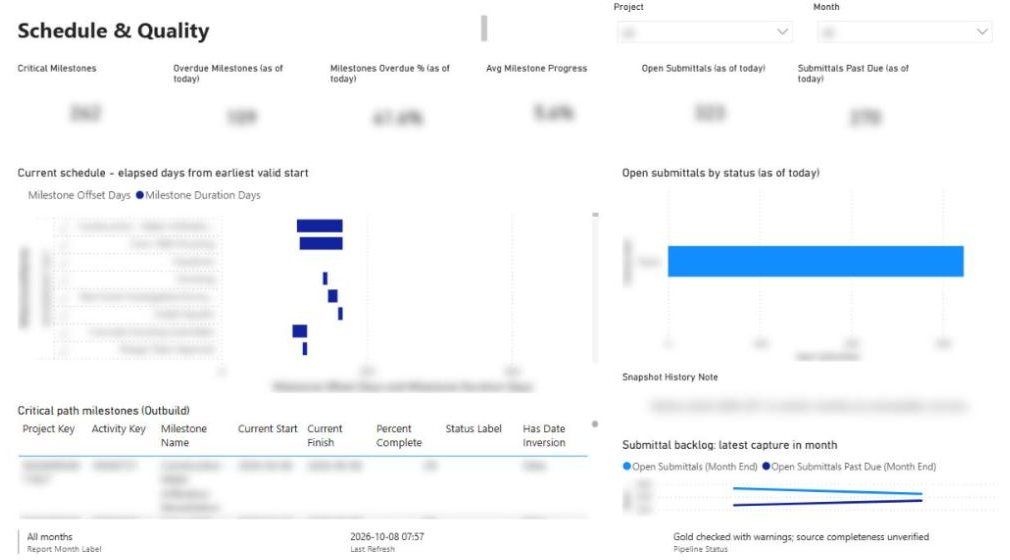
- KPIs: critical milestones, overdue milestones, % overdue, average milestone progress, open submittals, submittals past due.
- Visuals: a Gantt chart built from a stacked bar, open submittals by status, critical-path milestone table with a date-inversion flag, month-end submittal backlog trend.
Safety & Quality
Safety and quality figures counted from Procore records instead of typed in each month.
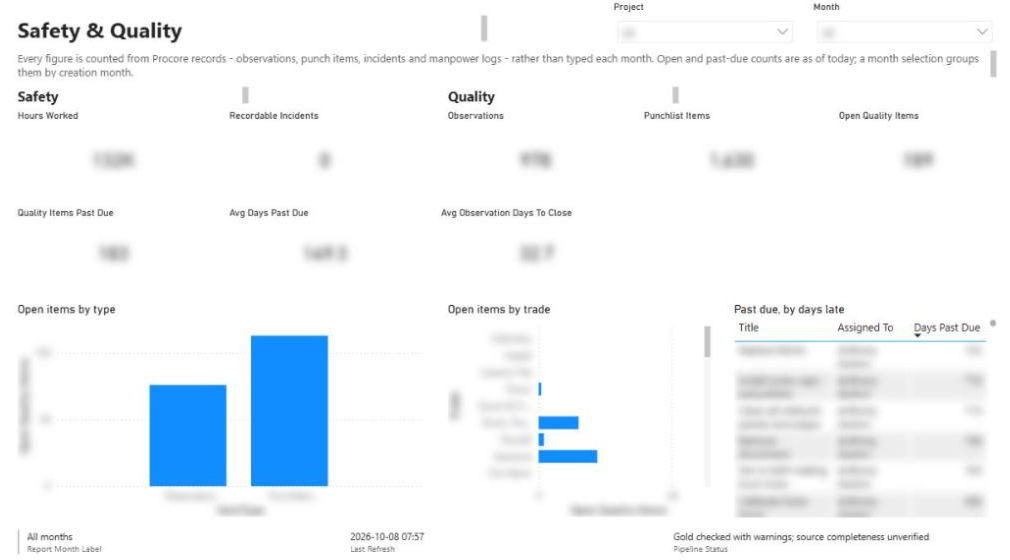
- KPIs: hours worked, recordable incidents, observations, punch items, open quality items, items past due, average days past due, average days to close an observation.
- Visuals: open items by type, open items by trade, past-due list sorted by days late with assignee.
Billing & Retainage
Owner and subcontractor pay-application balances and the net retainage position.
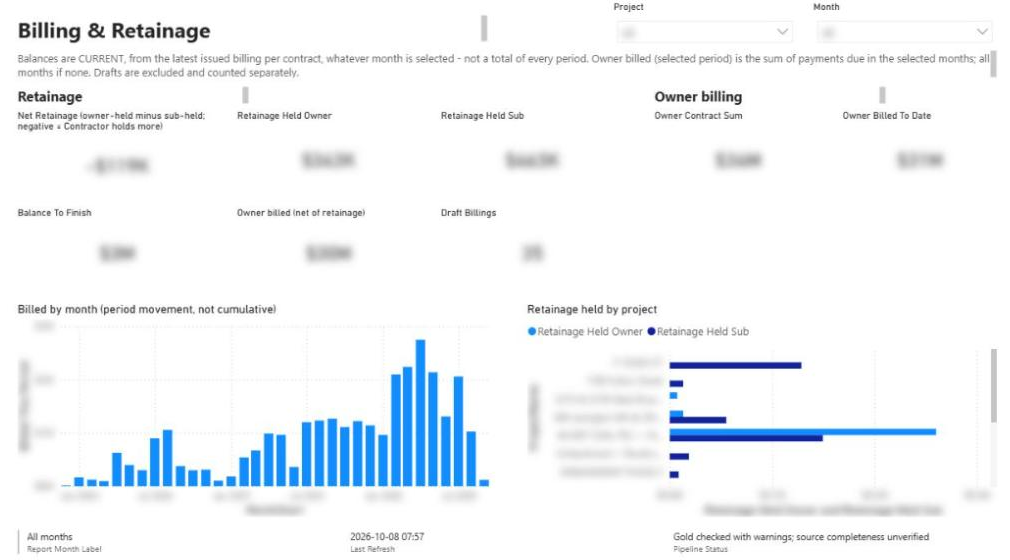
- KPIs: net retainage (owner-held minus sub-held), retainage held by owner, retainage held on subs, owner contract sum, owner billed to date, balance to finish, billed this period (net of retainage), draft billings.
- Visuals: billed by month (period movement), retainage held by project.
- Logic: pay-app columns are running balances, so balances are read only from each contract's latest issued (or approved) billing. Summing across periods would multiply them.
Direct Costs & Vendors
Self-performed cost, vendor commitments, vendor prequalification, and a check of Procore spend against accounting.
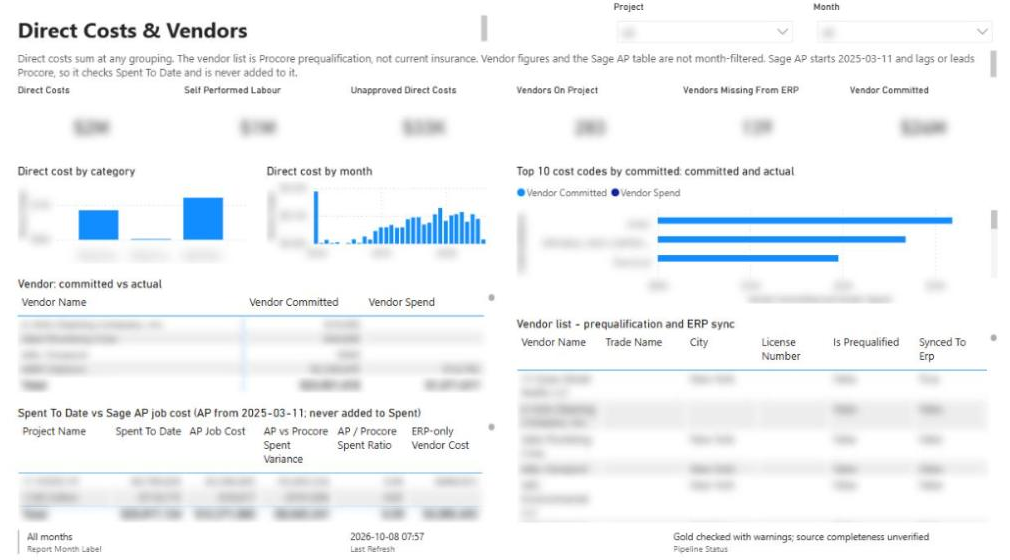
- KPIs: direct costs, self-performed labor, unapproved direct costs, vendors on project, vendors missing from the ERP, vendor committed.
- Visuals: direct cost by category and by month, top 10 cost codes by committed vs actual, vendor committed vs actual, vendor list with prequalification and ERP-sync flags, Procore spent to date vs Sage AP job cost by project.
- Logic: AP job cost is used only to reconcile and is never added to spend. "ERP-only vendor cost" shows spend Procore cannot see.
Vendor Insurance
Certificate-of-insurance compliance, with coverage and currency tracked separately.
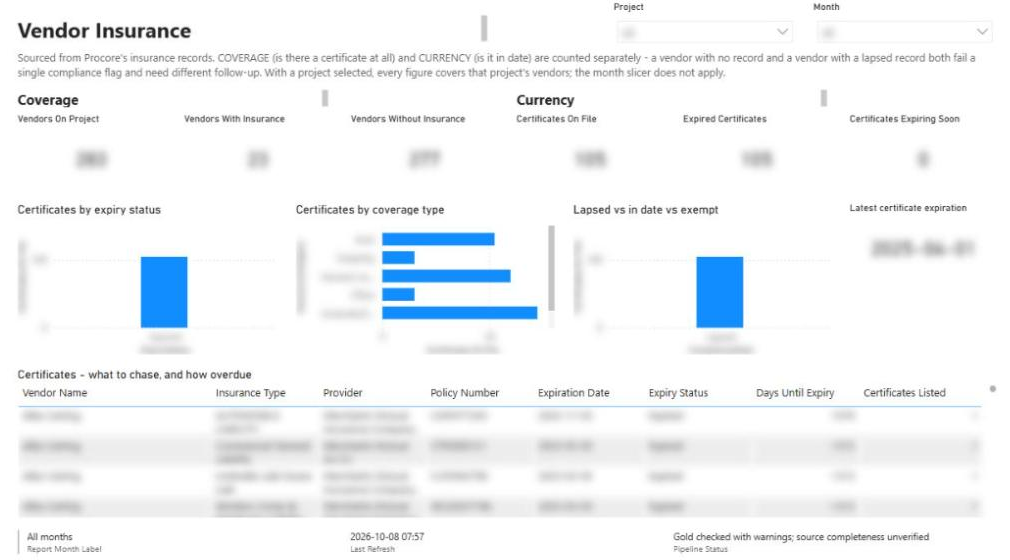
- KPIs: vendors on project, vendors with insurance, vendors without insurance, certificates on file, expired certificates, certificates expiring within 30 days.
- Visuals: certificates by expiry status, by coverage type, and by lapsed / in date / exempt; a chase list with vendor, policy, expiry date and days until expiry.
- Logic: expiry status bands are expired, within 30 days, within 90 days, current. Exempt vendors are never chased.
Scorecard
A transparent, weighted project health score with the arithmetic shown (detail in the Scorecard section below).
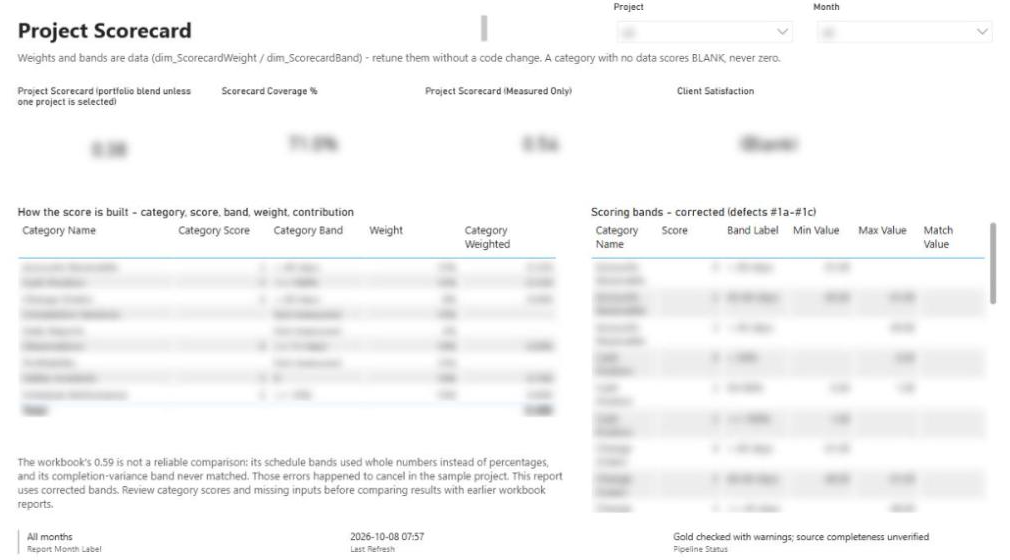
- KPIs: project scorecard (0–1), scorecard coverage %, measured-only scorecard, client satisfaction.
- Visuals: how the score is built (category, score, band, weight, contribution) and the band table itself.
Source Coverage
Shows which projects exist in all three systems, so a project missing from accounting cannot quietly report zero revenue.
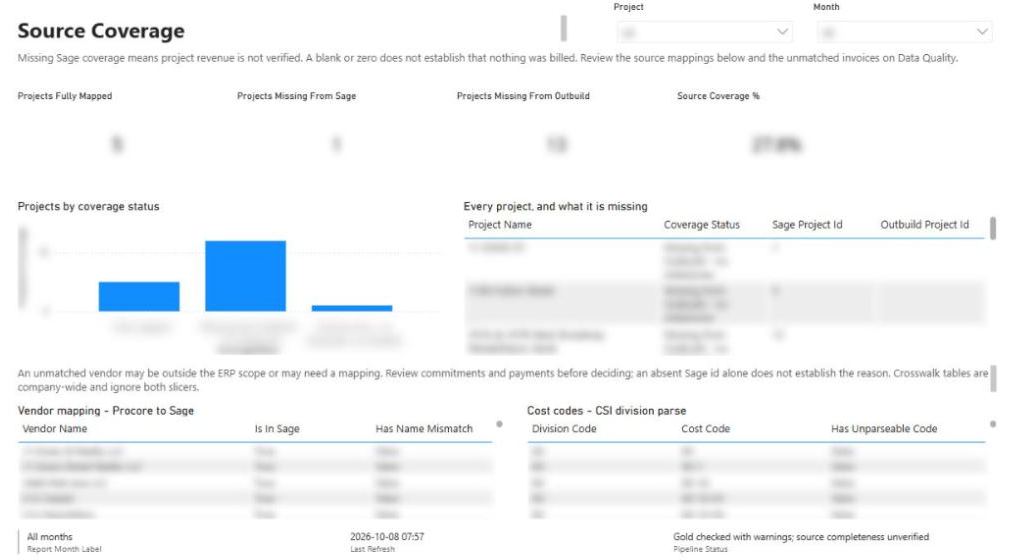
- KPIs: projects fully mapped, missing from Sage, missing from the scheduler, source coverage %.
- Visuals: projects by coverage status, every project and what it is missing, Procore-to-Sage vendor mapping, cost-code division parse check.
Data Quality
Pipeline health, key data-quality counts and an invoice-level trace.
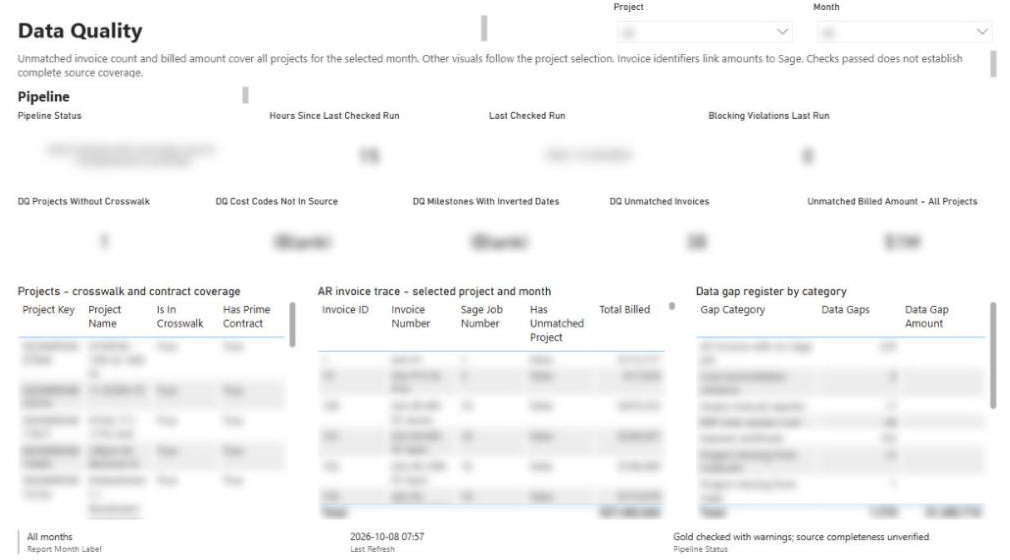
- KPIs: pipeline status, hours since last checked run, blocking violations, projects without a crosswalk entry, cost codes not in source, milestones with inverted dates, unmatched invoices and their billed amount.
- Visuals: crosswalk and prime-contract coverage by project, AR invoice trace for the selected project and month, data-gap register by category.
Unresolved Records
A worklist with one row per record that is missing, unmatched or unassigned, and the system to fix it in.
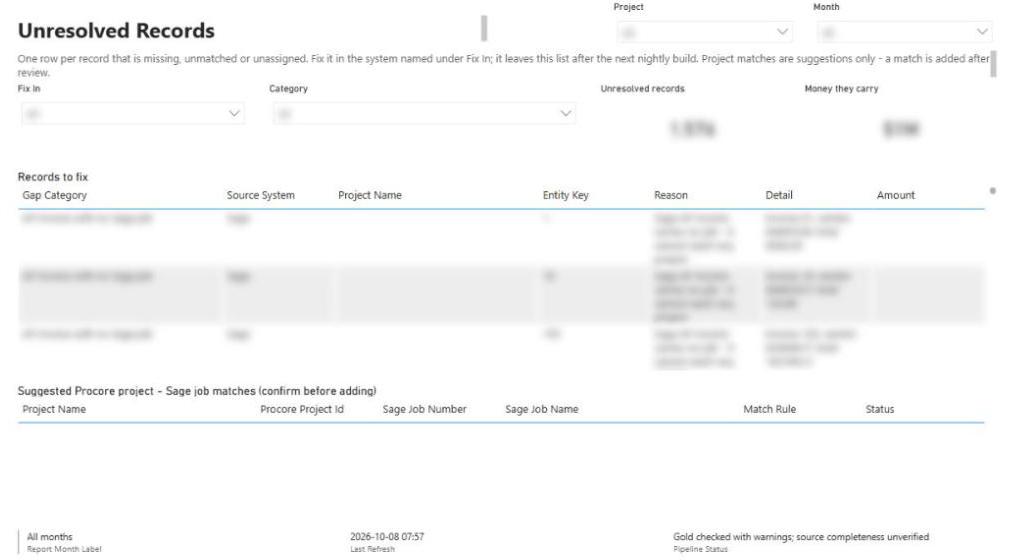
- KPIs: unresolved records, money they carry.
- Visuals: records to fix (category, source system, project, reason, amount), filterable by "Fix in" system; suggested Procore-to-Sage project matches for a person to confirm.
- Logic: a row drops off automatically after the next nightly run once it is fixed at source.
Project Detail (drill-through)
Right-click any project on any page and choose Drill through to open a single-project view.
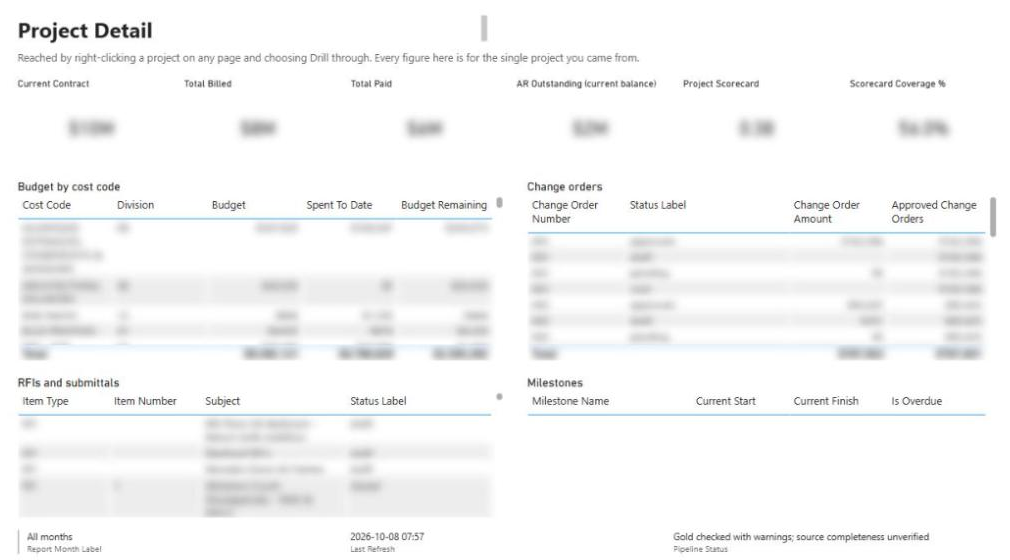
- KPIs: current contract, total billed, total paid, AR outstanding, project scorecard, scorecard coverage %.
- Visuals: budget by cost code, change orders, RFIs and submittals, milestones with an overdue flag.
Report 2: Project Quality Plan (9 pages)
This report replaces a 44-sheet QA/QC workbook. Every figure is computed from registers rather than typed beside them. It shares the project and date dimensions with the Monthly Progress Report, so both reports always agree on what counts as a project.
Quality Portfolio
The quality dashboard across all projects.
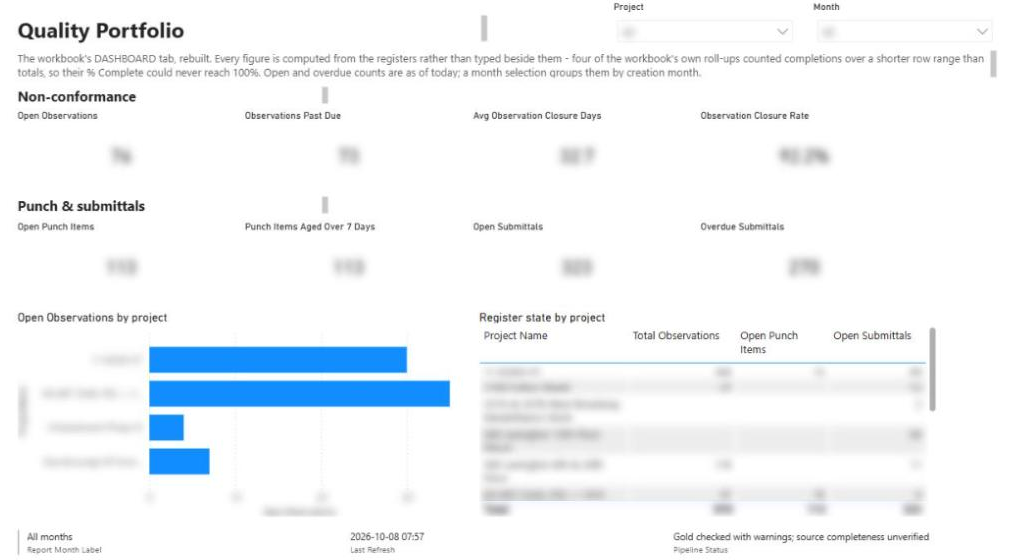
- KPIs: open observations, observations past due, average observation closure days, observation closure rate, open punch items, punch items aged over 7 days, open submittals, overdue submittals.
- Visuals: open observations by project; register state by project (observations, open punch, open submittals).
Observations
The Procore observation register, used as the non-conformance log.
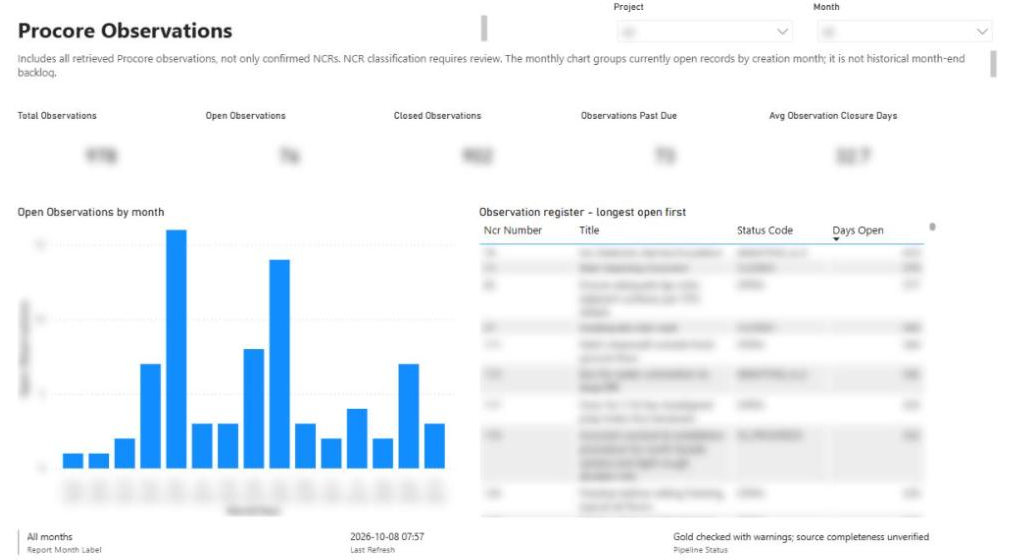
- KPIs: total, open and closed observations, observations past due, average closure days.
- Visuals: open observations by creation month; register sorted longest open first.
Punch & Completion
Punch ageing against the client's escalation policy: over 5 days goes to the trade PM, over 7 days to the trade executive.
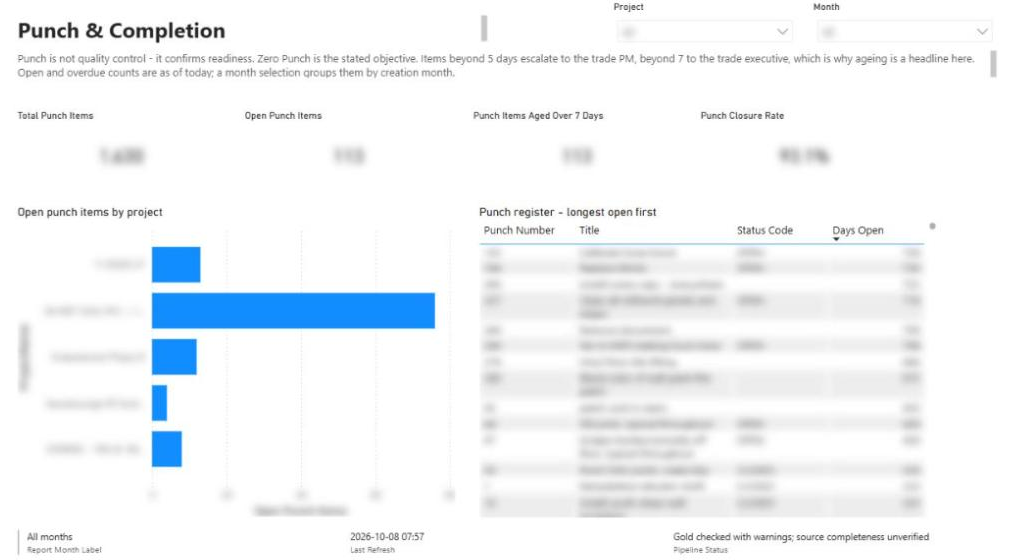
- KPIs: total punch items, open punch items, items aged over 7 days, punch closure rate.
- Visuals: open punch items by project; punch register sorted longest open first.
Submittals & Mock-Ups
Submittal turnaround and backlog, plus mock-ups inferred from submittal text.
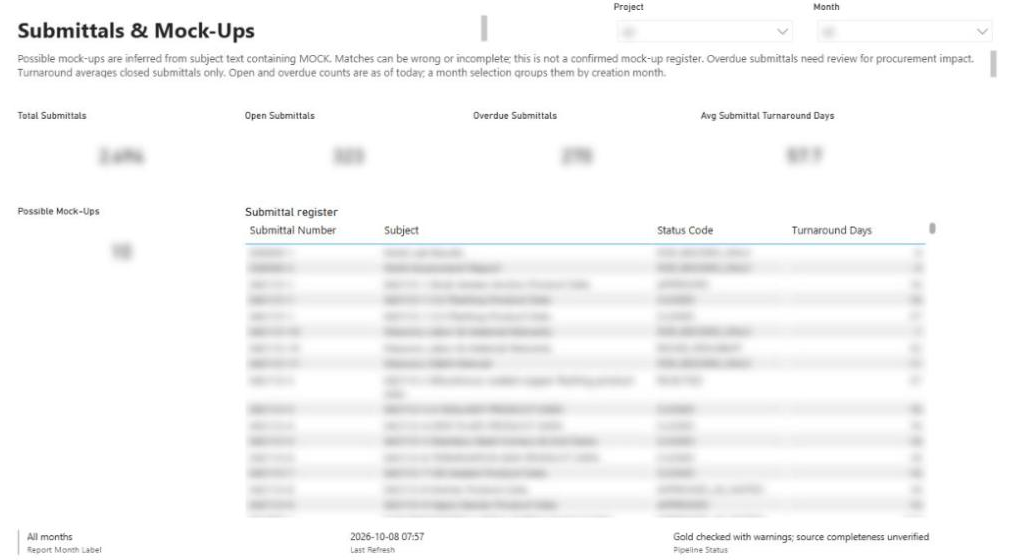
- KPIs: total submittals, open, overdue, average turnaround days, possible mock-ups.
- Visuals: submittal register with status and turnaround days.
Procore Inspections
Native Procore inspections, kept exactly as the source records them.
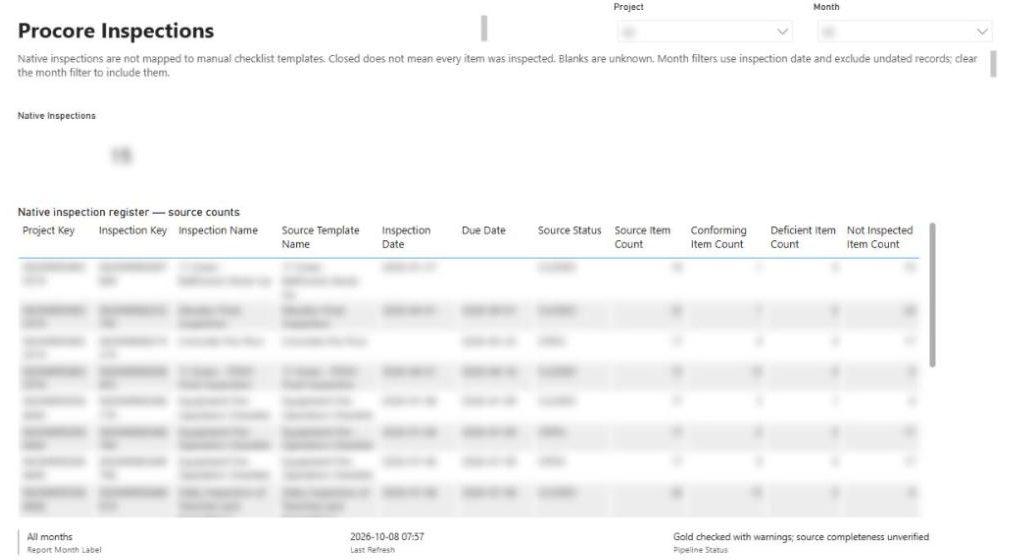
- KPIs: native inspections.
- Visuals: inspection register with template, inspection and due dates, status, and conforming / deficient / not-inspected item counts.
Inspection Items
The item-level responses behind each inspection, with original source labels unchanged.
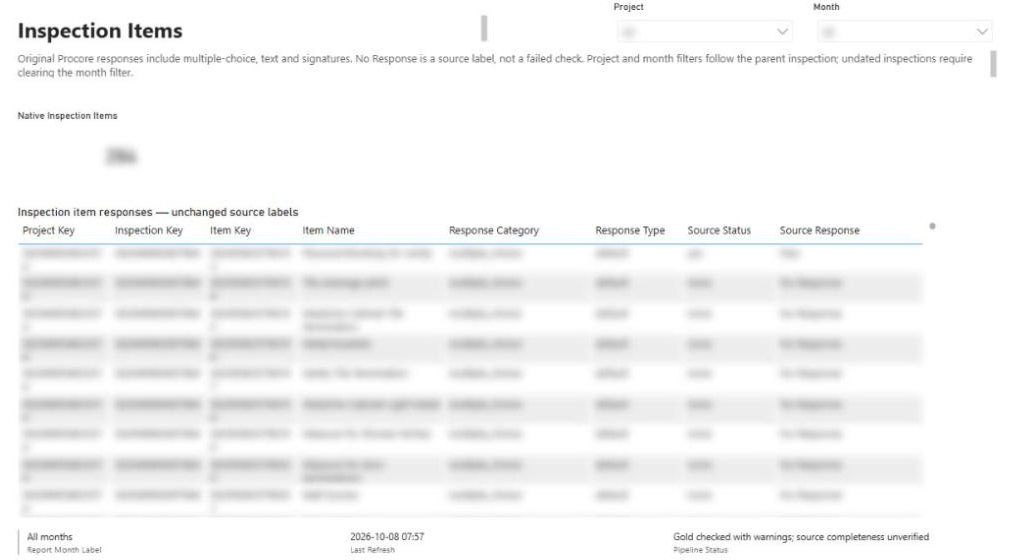
- KPIs: native inspection items.
- Visuals: item responses with response category, type, status and the original answer.
Statutory Gates
Progress against templated regulatory pathways: temporary certificate of occupancy, fire alarm and statutory inspections (93 gates in the template).
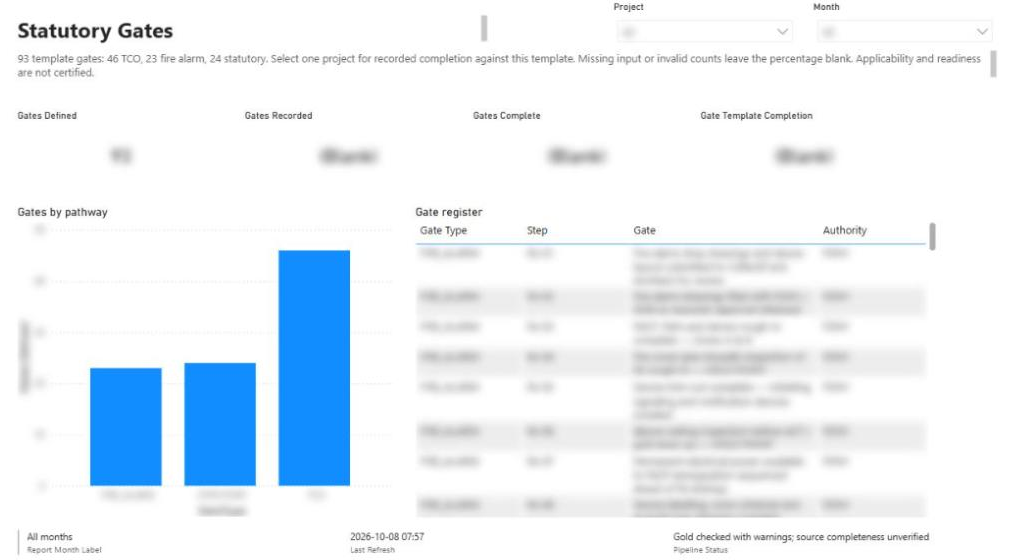
- KPIs: gates defined, gates recorded, gates complete, gate template completion %.
- Visuals: gates by pathway; gate register with step and authority.
- Logic: completion % shows only when one project is selected and the inputs are valid; otherwise it stays blank.
Trade Checklists & DFOW
Trade QC checklist templates (26 trades, 625 items), the Definable Features of Work risk register, the inspection and test plan, and special inspections.
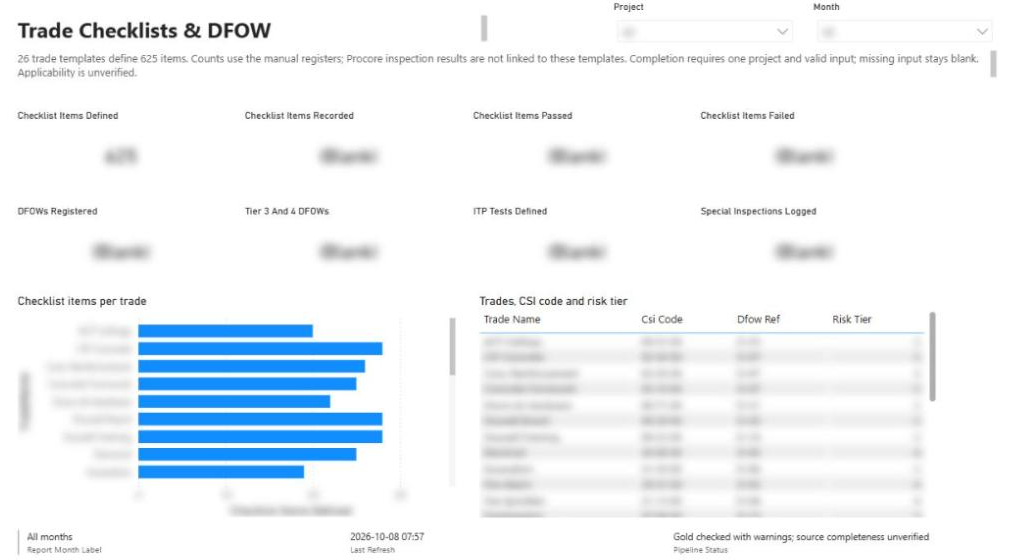
- KPIs: checklist items defined, recorded, passed and failed; DFOWs registered; tier 3 and 4 DFOWs; ITP tests defined; special inspections logged.
- Visuals: checklist items per trade; trades with CSI code, DFOW reference and risk tier.
Data Quality
Trade-mapping gaps, empty manual registers and pipeline health for the quality model.
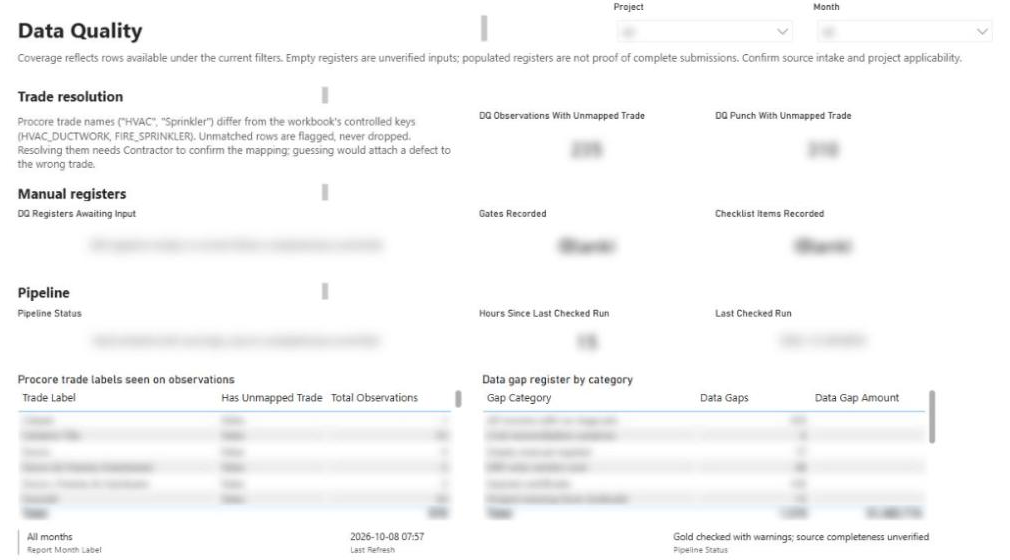
- KPIs: observations and punch items with an unmapped trade, registers awaiting input, gates and checklist items recorded, pipeline status.
- Visuals: Procore trade labels seen on observations and whether they map; data-gap register by category.
- Logic: Procore's free-text trade names are mapped to controlled trade keys. Unmatched rows are flagged, never dropped.
Project health scorecard
Each project gets a 0–1 health index from nine weighted categories, each scored 3, 2 or 0 against bands stored as data. Management can retune weights and bands without a developer. A category with no data scores blank, not zero, and Scorecard Coverage % shows how much of the score is real.
| Category | Weight | Measured by | Score 3 | Score 2 | Score 0 |
|---|---|---|---|---|---|
| Schedule performance | 15% | Milestones overdue % | Under 5% | 5–9% | 10% or more |
| Completion variance | 15% | Forecast finish minus baseline finish | 0 days or early | 1–14 days | 15+ days |
| Safety incidents | 14% | Recordable incidents | 0 | 1 | 2 or more |
| Accounts receivable | 12% | Average days to payment | Under 45 | 45–60 | Over 60 |
| Profitability | 12% | Manager's judgement (manual input) | Within range | Out of range, plan in place | Margin fade, no plan |
| Cash position | 12% | (Paid + AR outstanding) ÷ cost to complete | 100% or more | 50–99% | Under 50% |
| Observations | 10% | Average days to close an observation | Under 6 | 6–10 | 11 or more |
| Change orders | 8% | Age of oldest unapproved change order | 45 days or less | 46–60 | Over 60 |
| Daily reports | 2% | Daily logs not completed same day | Under 2 | 2–4 | 5 or more |
The score is Σ(score × weight) ÷ 3. The measured-only version divides by coverage, so partly measured projects compare fairly; below 0.6 counts as at risk.
Metric catalogue
The two models hold about 180 measures across ten business areas; this table lists what each area tracks and how the less obvious figures are defined.
| Area | Metrics tracked | How key figures are defined |
|---|---|---|
| Contract and change orders | Original contract, current contract, contract growth %, pending COs, approved COs, CO amount by status, age of oldest unapproved CO | Contract values take each project's latest month, so monthly repeats are not double counted |
| Budget and cost | Budget, forecast, committed, spent to date, cost to complete, budget remaining and %, forecast variance and %, budget and forecast status, percent bought out, budget on new cost codes % | Status bands: within budget / over by up to 5% / over by more than 5%. Percent bought out = committed ÷ budget |
| Direct cost and reconciliation | Direct costs, self-performed labor, unapproved direct costs, AP job cost, AP vs Procore spend variance and ratio, ERP-only vendor cost | AP job cost cross-checks Procore spend and is never added to it |
| Billing, cash and AR | Total billed, billed % of contract, billed month-on-month %, total paid, cash received, AR outstanding, average days to payment, cash position %, billed cumulative (S-curve) | "Total paid" is paid against invoices issued in the period; "cash received" is dated by payment |
| Retainage and pay apps | Owner contract sum, owner billed to date, balance to finish, billed this period, retainage held by owner, retainage held on subs, net retainage position, draft billings | Balances come from each contract's latest issued (owner) or approved (sub) pay app |
| Vendors and insurance | Vendors on project, vendors missing from ERP, vendor committed and spend by cost code, vendors with / without insurance, certificates on file, expired, expiring within 30 days, latest expiry | Coverage (any certificate) and currency (in date) are counted separately |
| Schedule | Critical milestones, overdue milestones, % overdue, average milestone progress, completion variance days, Gantt offset and duration | Overdue = finish date passed and under 100% complete |
| Safety | Hours worked, recordable incidents, daily reports missed | Blank, not zero, when no hours are logged |
| Quality, punch and inspections | Observations (total, open, closed, past due, closure days, closure rate), punch (total, open, aged over 7 days, closure rate, average days open), open quality items, items past due, native inspections and items, gates defined / recorded / complete / completion %, checklist items defined / recorded / passed / failed, DFOWs and tier 3–4 DFOWs, ITP tests, special inspections, inspector visits, commissioning systems accepted, health-department items verified | Completion % appears only for a single project with valid inputs |
| Submittals and RFIs | Total, open, draft and overdue submittals, average and median turnaround days, possible mock-ups, average days open | Open excludes drafts; mock-ups are inferred from subject text |
| Scorecard | Nine category scores, category band, weighted contribution, project scorecard, measured-only scorecard, coverage %, projects at risk, projects reporting, client satisfaction | See the scorecard section above |
| Data quality and coverage | Projects fully mapped, missing from Sage or the scheduler, source coverage %, projects without a crosswalk, cost codes not in source, inverted milestone dates, unmatched invoices and amount, data gaps and gap amount, unmapped trades, registers awaiting input | Only unmatched invoices carry money in the gap register, to avoid double counting |
| Freshness and history | Last refresh, last checked run, hours since last checked run, pipeline status, blocking violations, month-end snapshots of backlogs and balances, snapshot history note | Month-end values are saved on each passing run; earlier months read as unavailable, not zero |
Design features worth replicating
These are the choices that made the numbers trusted rather than just visible. Most carry over to any contractor running a PM system alongside an accounting system.
- A data-quality gate before anything publishes. About 200 rules run nightly; a blocking failure stops the refresh. A stale report beats a wrong one.
- Blank, never zero. Missing data shows as blank or "Not measured", so a gap cannot pass for a good result.
- An unresolved-records worklist. Every rejected row, unmatched invoice, unmapped trade and missing mapping lands in one list. Each row names the system to fix it in and the money it carries.
- Cross-system coverage checks. Each project is checked for presence in the PM system, accounting and the scheduler, so a project missing from accounting cannot show zero revenue unnoticed.
- Cost-code crosswalk across three coding schemes. Legacy, old-ERP and new cost codes map to one structure through version-controlled tables, with a measure of how much budget maps cleanly.
- Independent cost reconciliation. Procore spend is compared with accounting AP job cost by project, without ever adding the two together.
- Correct retainage from pay applications. Running balances are read from the latest issued or approved period only, giving owner, subcontractor and net retainage the ERP could not supply.
- Insurance coverage separate from currency. "No certificate" and "lapsed certificate" need different follow-up, so they are counted and listed separately.
- A transparent, retunable scorecard. Weights and bands live in tables and the page shows the arithmetic for every category.
- Month-end snapshots. "As of today" backlogs are captured each night, so month-end trends are real history rather than reconstructions.
- Manual inputs with an audit trail. Risks, wins, client surveys, baseline dates and QA/QC registers go into versioned SharePoint lists, and empty registers are flagged.
- Drill-through and in-page guidance. Right-click any project for its detail page; every page carries a one-paragraph note on how to read it.
- Built as code. Models, reports, SQL, quality rules and the pipeline deploy from version control by script, so changes are reviewable and reversible.
How we built it
The whole platform is code. Fabric notebooks implement the bronze → silver → gold lakehouse; semantic models, report definitions, SQL, and quality rules live in version control and deploy by script. Credentials sit in Azure Key Vault and every source connection is read-only.
We built it with Claude working through MCP servers for Microsoft Fabric, Azure, and Power Automate—then tested every report page end-to-end with Claude in Chrome before the client saw it. The video walkthrough shows each layer.
Running Procore with QuickBooks instead of Sage? See the Procore, QuickBooks & HubSpot reporting example.
Next step
Have a problem like this?
Tell us the outcome you need. We'll tell you honestly how we'd approach it, and reply within two business days.
Keep learning
Reporting & analytics · October 7, 2026
How We Built Construction Reporting in Microsoft Fabric
The engineering behind a nightly Procore + Sage + Outbuild reporting platform in Microsoft Fabric: medallion lakehouse, cost-code mapping, a quality gate, and building it with Claude and MCP servers.
Reporting & analytics · October 8, 2026
Construction Data Quality: The Rules That Make Reports Trustworthy
A practical checklist of the data-quality rules behind construction reports people can defend, from quality gates and blank-never-zero to cost-code crosswalks, reconciliation and snapshots.
Playbooks · October 8, 2026
Playbook: Replacing the Monthly Excel Report for Contractors
A step-by-step program for retiring a contractor's hand-built monthly Excel report: inventory the workbook, map sources, give manual data a home, build crosswalks and a gated pipeline, pilot in parallel, then retire the spreadsheet.