Short answer: A construction WIP report in Power BI calculates, for every open job, percent complete (cost to date ÷ estimated cost at completion), earned revenue (contract × percent complete), and the gap between earned and billed: over billing or under billing. Contract, cost and forecast data usually comes from your project management system, such as Procore. Billing and job cost come from accounting. To automate it reliably, join the two systems on a project crosswalk, validate the data before every refresh, and snapshot each month-end so reported figures never move.
This guide is for controllers, CFOs and the people who build their reports. It covers the math, the data you need, the mistakes that make a WIP schedule look right while being wrong, and how we automate it in Microsoft Fabric and Power BI.
What a WIP report is, and why it matters
A work-in-progress (WIP) report, or WIP schedule, is a job-by-job view of every contract that is not finished. For each job it shows what you expect to earn, what you have earned so far based on progress, and what you have billed. The difference between earned and billed is where most of the value lives.
Three groups depend on it:
- Controllers and CFOs use it to recognize revenue under percentage-of-completion accounting and to close the month.
- Owners and operations leaders use it to see which jobs are losing margin before the job is over.
- Sureties and lenders read it to judge whether the company is billing ahead of its work, behind it, or hiding a fade.
For most contractors the WIP schedule is still an Excel workbook. Someone exports from the project system, exports from accounting, pastes both into tabs and reconciles by hand every month. That is the process we are usually asked to replace.
The core WIP formulas
Most contractors use the cost-to-cost input method: progress is measured by how much of the expected cost has been spent. These are the definitions we use in our Power BI builds, and they tie to what a controller already prepares.
| Metric | Formula | What it tells you |
|---|---|---|
| Revised contract | Original contract + approved change orders | What you will be paid if nothing else changes. Keep pending change orders separate as exposure. |
| Estimated cost at completion (EAC) | Cost to date + estimated cost to complete | What the job will cost when it is done. This is the number that drives everything else. |
| Percent complete | Cost to date ÷ EAC | How far through the job you are, by cost. |
| Earned revenue | Revised contract × percent complete | Revenue you have the right to recognize to date. |
| Over billing | Billed to date − earned revenue (when positive) | Billed ahead of the work. A liability: "billings in excess of costs and estimated earnings." |
| Under billing | Earned revenue − billed to date (when positive) | Work done but not billed. An asset: "costs and estimated earnings in excess of billings." |
| Gross profit at completion | Revised contract − EAC | Expected margin on the whole job. |
| Fade / gain | Change in GP % at completion from one month to the next | Whether the job's expected margin is shrinking (fade) or growing (gain). |
| Backlog | Revised contract − earned revenue | Contract revenue not yet earned. |
| Backlog months | Backlog ÷ average monthly earned revenue (we use the last three months) | How long current work will keep you busy at today's pace. |
A worked example
Take one hypothetical job, numbers chosen to keep the math easy:
- Revised contract: $1,000,000. EAC: $850,000.
- Cost to date: $425,000, so percent complete is 425,000 ÷ 850,000 = 50%.
- Earned revenue: $1,000,000 × 50% = $500,000.
- Billed to date: $560,000, so the job is over billed by $60,000.
- Gross profit at completion: $150,000, or 15%.
Next month the project manager raises EAC to $900,000. GP % at completion drops from 15% to 10%: that 5-point change is the fade. With cost to date unchanged, percent complete drops to about 47.2% (425,000 ÷ 900,000), earned revenue falls to about $472,000, and over billing grows to about $88,000, even though nobody sent a new invoice. This is why a WIP report is only as good as the cost-to-complete forecast behind it.
Over billing vs under billing in plain terms
Over/under billing is one of the lines sureties and lenders read most closely. Modest over billing on a healthy job is normal and helps cash flow. Persistent under billing is often a warning sign: costs are running ahead of what you can bill, change orders are not being processed, or billing is simply late. Either way, the WIP report should show the net figure and the gross over and under amounts separately, because a large over billing on one job can hide a large under billing on another.
Where the WIP data comes from
A WIP schedule mixes two kinds of data: forecast data that lives with the project team, and financial data that lives in accounting. In a Procore shop the split usually looks like this:
| Input | Typical source | Notes |
|---|---|---|
| Original contract, approved change orders | Procore prime contracts and change orders | Pending change orders tracked separately. |
| Budget, EAC, cost to complete | Procore budget and forecast | The project manager's forecast. If it is stale, the whole WIP is stale. |
| Commitments | Procore commitments and commitment change orders | Useful for checking EAC against what is already bought. |
| Cost to date | Procore direct costs and invoices, and/or accounting job cost | Pick one as the system of record and compare against the other. |
| Billed to date | Procore pay applications or accounting AR invoices | Same rule: one source of record, one cross-check. |
| Retainage | Pay applications or accounting | Report it so billed-to-date and cash are not confused. See retainage. |
Accounting can be QuickBooks Online, Sage 100 Contractor or another ERP. In our Procore, QuickBooks and HubSpot build, Procore drives contract, EAC, cost to date and billing, and QuickBooks job cost is compared against Procore cost to date as a separate cost variance measure by project. A difference is a finding to review, not automatically an error. In our monthly report rebuild on Procore, Sage and Outbuild, Sage 100 Contractor provides AR and AP through read-only SQL access.
The hard part is not pulling the data. It is joining it. Procore, accounting and a CRM rarely share a project ID, so you need a crosswalk that says which Procore project is which accounting job.
How to build an automated WIP report in Power BI
This is the sequence we follow. It works whether you start with two systems or five.
- Agree the definitions first. Write down, with the controller, how percent complete, earned revenue, over/under billing and fade are calculated, including edge cases: what happens with no EAC, a negative margin, or cost above EAC. The table above is a good starting point.
- Choose a system of record for each input. Decide where contract, EAC, cost to date and billed to date come from, and which system is only a cross-check.
- Extract through the APIs, read-only. In our builds, Procore uses a custom app with its own client ID and secret, and QuickBooks Online uses an Intuit app with the OAuth authorization code flow. We plan for that QuickBooks authorization to need a fresh sign-in roughly every 100 days, so give it an owner and a reminder.
- Land the raw data first. Store API payloads as received (bronze), then type and validate them (silver), then model them as a star schema (gold). This is the medallion architecture. When a transformation is wrong, you re-run it from bronze instead of re-pulling from the API.
- Build the project crosswalk. Apply match rules in a strict order: the controller's manual mapping wins, then an exact project number match, then a name match only when it is unambiguous. Anything unmatched stays in the totals and is flagged.
- Write the measures once, in the semantic model. Every page should use the same governed measures in the semantic model. If two pages calculate earned revenue differently, someone will notice in a meeting.
- Gate the refresh on data-quality checks. Run checks before anything publishes. A failure that would make a number wrong should stop the refresh, and the report should keep showing the last good version with a visible note that the latest run failed.
- Snapshot month-end. Store one WIP row per project per month. Month-end figures must stay as reported, even after the forecast changes. Fade and gain are calculated from these snapshots.
- Build the pages people actually use. At minimum: a portfolio view, the WIP schedule itself, a per-project drill-down by cost code, backlog, and an exceptions page.
- Reconcile against the old workbook before switching. Run the new report and the Excel WIP side by side for at least one close. Every difference is either a bug in the new build or a bug in the old one, and both are worth finding.
Common WIP reporting mistakes
These are the failure modes we design against. Several came straight out of our own builds.
A WIP schedule that balances and is still wrong
When we pointed one build at live data, a budget column whose name contained spaces silently returned zero. The resulting WIP schedule satisfied every accounting identity, because over billing minus under billing still equaled billed minus earned. It was also completely wrong. Internal consistency is not correctness. Add checks that compare totals to the source, and check that key columns are not unexpectedly all zero.
Missing projects look like quiet projects
A project missing from a financial system often does not throw an error. It shows up as $0 revenue and $0 billing, which looks exactly like a job with no activity. We now treat source coverage as a first-class report page: which projects are present, missing or unmatched in each system. Unmatched projects stay in totals and appear on an exceptions list. In our design principles this is "flag, never drop."
Blank and zero treated the same
A job with no EAC entered is not a job with zero cost to complete. If the report fills blanks with zero, percent complete and margin come out absurd. We label these jobs "No forecast" rather than calculating a number we know is wrong: "blank, never zero."
Percent complete above 100%
When cost to date passes EAC, cost-to-cost percent complete goes above 100% and earned revenue goes above contract. In our builds percent complete is capped at 100%, and those jobs are surfaced as over their estimate at completion so someone updates the forecast. A job with a projected loss also needs accounting attention: under percentage-of-completion accounting, an anticipated loss on a contract is generally recognized in full when it becomes known. Confirm the treatment with your CPA.
Recalculating history
If the report only holds the current forecast, every past month changes when an EAC moves. Your board pack from March no longer matches March. Monthly snapshots fix this, and they are the only honest way to show fade and gain.
Counting the pipeline as backlog
Signed work belongs in backlog. A CRM deal at 60% probability does not. In our Procore, QuickBooks and HubSpot report, won work enters only through Procore, and "total forward work" shows backlog and weighted pipeline side by side, never added together.
Hidden scoring and formula errors in the old workbook
When we rebuilt one contractor's monthly report, we found two scoring formulas in the original Excel workbook that were wrong in ways that happened to offset each other on the sample project, so the total looked right. Spreadsheet logic is rarely tested. Moving it into a governed model with explicit, testable rules is often where the first real findings come from.
What a good Power BI WIP report includes
From our builds, these pages earn their place:
- Portfolio: every open job with revised contract, EAC, percent complete, GP % at completion and a simple risk label (for example: no forecast, at risk below 0%, watch below 10%, otherwise on track).
- WIP schedule: the controller's deliverable, with revised contract, original budget, EAC, cost to date, percent complete, earned revenue, billed to date, over billing, under billing and gross profit.
- Project drill-down: budget vs committed vs cost to date vs EAC by cost code, projected over/under by cost code, fade/gain by month, and the change-order log.
- Backlog and burn: backlog value and backlog months by project and month.
- Exceptions: projects at risk, projects over EAC, cost codes projected over, unmapped projects, and the cost variance between project and accounting systems.
- Billing and retainage, AR and collections, and a cash forecast built from issued invoices and bills, so the WIP is read alongside cash.
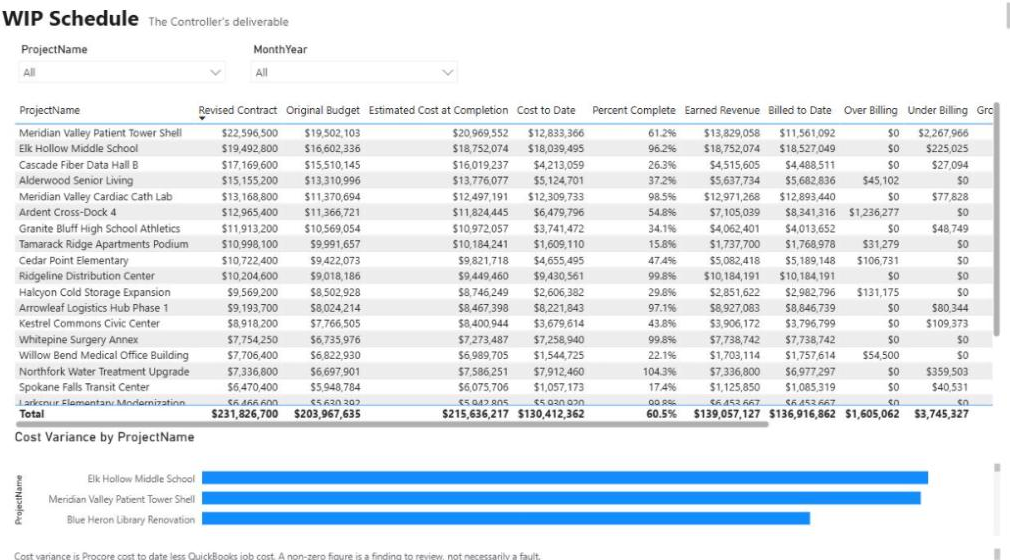
The WIP schedule above is from our demo build, loaded with sample data for a fictional contractor of about 20 projects and $232M of contract value. On that data it shows $130M cost to date, $137M billed, $1.6M over billed and $3.7M under billed, with the Procore-vs-QuickBooks cost variance alongside.
How we approach WIP reporting
We build WIP reporting as code, not as a one-off workbook or a single PBIX file. The pattern is the same across our builds, and is laid out on our approach page:
- Microsoft Fabric lakehouse with notebooks for extraction, a registry of API endpoints so new Procore endpoints are a configuration change, and rate limiting built into the extract.
- Bronze, silver and gold layers so raw payloads are kept and every transformation can be re-run.
- A quality gate before publish. In our Procore, QuickBooks and HubSpot build, data-quality checks run before every refresh, backed by 53 tests and 203 offline assertions; a blocking failure stops the refresh and the report keeps the last good version. Our monthly report rebuild on Procore, Sage and Outbuild uses 63 data-quality expectations to stop bad data before it reaches the report.
- A governed semantic model (68 measures in the QuickBooks build, 99 in the monthly report rebuild) that every page reads from.
- Everything in GitHub, including the Power BI report definition, so changes are reviewed as diffs.
The Procore, QuickBooks and HubSpot walkthrough shows the full WIP build end to end, including the crosswalk. The monthly report rebuild shows the same approach replacing an 11-tab Excel workbook with around 700 manually maintained input cells, on Procore, Sage 100 Contractor and Outbuild.
A sensible way to start is small: Procore plus your accounting system, the WIP schedule, the exceptions page and month-end snapshots. Cash forecast, capacity and CRM pipeline can be added once the core numbers are trusted.
Where to go next
- Watch the build: Procore, QuickBooks and HubSpot into one WIP dashboard
- See every report page and metric definition: Procore, QuickBooks and HubSpot reporting
- Read the playbook: Replacing the monthly Excel report
- Still reconciling WIP by hand every month? Tell us what you're working with and we'll show you what an automated version would look like on your systems.
Frequently asked questions
How do you calculate percent complete on a WIP schedule?
Most contractors use the cost-to-cost method: cost to date divided by estimated cost at completion. Earned revenue is then revised contract multiplied by that percentage. If cost to date passes the estimate, cap percent complete at 100% and flag the job so the forecast gets updated.
What is the difference between over billing and under billing?
Over billing means you have billed more than you have earned based on progress, and it is reported as a liability. Under billing means you have earned more than you have billed, and it is reported as an asset. Sureties watch both, and persistent under billing is often an early warning of cost or change-order problems.
What is fade and gain in construction WIP?
Fade is a drop in a job's expected gross profit percentage at completion from one period to the next; gain is an increase. You can only measure it reliably if you keep a snapshot of each month-end WIP, because the current forecast overwrites the old one.
Can Power BI build a WIP report directly from Procore?
Partly. Procore holds most WIP inputs: contracts, change orders, budgets, forecasts, commitments and pay applications. Billing and job cost often need to come from accounting as well, so we land both in a Microsoft Fabric lakehouse, join them through a project crosswalk and validate them before Power BI reads the results.
Where should cost to date come from, Procore or accounting?
Pick one system of record and use the other as a cross-check. In our Procore and QuickBooks build, Procore drives the WIP and QuickBooks job cost is compared against it as a cost variance by project, which is reviewed as a finding rather than treated as an automatic error.
How long does it take to automate a WIP schedule?
It depends mostly on how many systems are involved and how clean the project mapping is. Starting with Procore plus your accounting system and the core WIP, exceptions and snapshot pages keeps the first version small; cash, capacity and CRM pipeline can be added after the core numbers are trusted.
Next step
Have a problem like this?
Tell us the outcome you need. We'll tell you honestly how we'd approach it, and reply within two business days.
Keep learning
Reporting & analytics · October 7, 2026
Procore, QuickBooks & HubSpot Reporting Example
A 10-page Financial Operating System in Power BI that gives owners and controllers one view of contracts, WIP, cost, cash, pipeline, and labor—joined across Procore, QuickBooks Online, and HubSpot.

Integrations · August 18, 2026
How We Joined Procore, QuickBooks and HubSpot in Microsoft Fabric
A build walkthrough of the pipeline that joins Procore projects, QuickBooks jobs and HubSpot deals in Microsoft Fabric, including the crosswalk that refuses to guess and the gate that stops wrong numbers.
Playbooks · October 8, 2026
Playbook: Replacing the Monthly Excel Report for Contractors
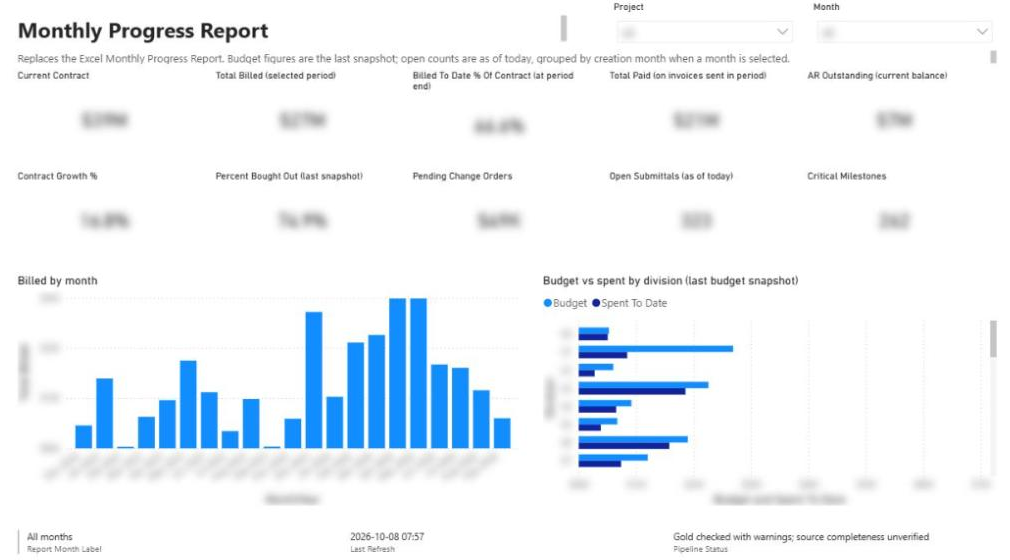
A step-by-step program for retiring a contractor's hand-built monthly Excel report: inventory the workbook, map sources, give manual data a home, build crosswalks and a gated pipeline, pilot in parallel, then retire the spreadsheet.