Construction reports become trustworthy when data-quality rules run before anything publishes, not after someone spots a bad number in a meeting. The core rules are simple: gate every refresh, show missing data as blank instead of zero, keep rejected rows in a table with a reason, route every unresolved record to the system where it gets fixed, and reconcile systems against each other without adding them together. This guide covers each rule, how to implement it, and how we applied it in a production reporting platform for a general contractor.
Why construction data quality is a different problem
Many contractors run at least three systems that each hold part of the truth: a project management platform such as Procore, an accounting system such as Sage or QuickBooks, and a scheduling tool such as Primavera P6 or Outbuild. On top of that sits a layer of spreadsheets for everything no system tracks: risks, wins, safety attestations, QA/QC registers.
The data problems that follow are predictable:
- A project exists in the PM system but was never set up in accounting, so it reports zero revenue.
- Cost codes changed between the old and new ERP, so half the budget lands in "unmapped".
- Pay-application balances are running totals, so summing them across months multiplies retainage.
- An AP invoice is posted to no job, so the cost exists but no project carries it.
- A safety metric reads "0 incidents" because nobody logged hours, not because nothing happened.
None of these throw an error. The report renders, the numbers look plausible, and the mistake surfaces weeks later, usually in front of an owner, a lender or a bonding agent. Data-quality rules exist to make these failures loud, early and assigned to someone.
Key definitions
Quality gate. A set of automated checks that runs after data is transformed and before reports refresh. A blocking failure stops publication; the report keeps showing the last good numbers.
Blank, never zero. A rule that a metric with no underlying data displays as blank or "Not measured", never as 0. Zero is a measurement. Blank is the absence of one.
Rejects table. A table that receives every row that fails validation, with the rule it failed and the source it came from. Rows are flagged, never silently dropped.
Unresolved-records worklist. A user-facing list of every record that is missing, unmatched or unassigned, the money it carries, and the system where it must be fixed.
Cross-system coverage. A check that each project exists in every system it should: PM, accounting and scheduling.
Cost-code crosswalk. A version-controlled mapping table that translates cost codes between systems or coding schemes into one reporting structure. See the crosswalk glossary entry.
Reconciliation. Comparing the same quantity from two independent sources (for example, PM-system spend vs accounting AP job cost) to measure the gap, without combining them.
Snapshot. A point-in-time copy of balances and backlogs saved on each passing run, so month-end history is real rather than reconstructed.
The eight rules at a glance
| Rule | What it prevents | How it shows up in the report |
|---|---|---|
| Quality gate before publish | A bad nightly load overwriting correct numbers | Pipeline status in every page footer: passed, warnings, late, stale or blocked |
| Blank, never zero | Missing data passing for a good result | "Not measured" or blank cells; a coverage % beside any composite score |
| Rejects table | Rows disappearing without a trace | Reject counts by rule and source on a data-quality page |
| Unresolved-records worklist | Gaps nobody owns | One row per issue, with amount and a "Fix in" system |
| Cross-system coverage | A project missing from accounting reporting $0 | Projects fully mapped vs missing from accounting or the scheduler |
| Cost-code crosswalk | Budget falling into "unmapped" after a code change | % of budget that maps cleanly; cost codes not found in source |
| Independent reconciliation | Double counting, or spend one system cannot see | PM spend vs accounting job cost by project, with variance |
| Snapshots | Fake month-end trends rebuilt from today's data | Month-end backlog and balance history; earlier months read as unavailable |
Rule 1: Put a quality gate in front of every refresh
The single most important rule: reports refresh only after checks pass. In a medallion architecture, raw data lands in bronze, gets typed and cleaned in silver, and is modeled in gold. The gate sits between gold and the semantic model refresh.
Classify every rule as blocking or warning:
- Blocking: structural failures that would make headline numbers wrong. A source returned zero rows, a primary key is duplicated, a contract total moved by an implausible amount overnight, a required dimension table is empty.
- Warning: real issues that affect a subset of records. An unmapped trade label, a milestone with a finish date before its start, an invoice with no matching project.
When a blocking rule fails, the refresh does not run and the report keeps yesterday's numbers, clearly labeled as stale. A stale answer beats a wrong one. When only warnings fire, the report publishes and the warnings flow into the worklist.
Every page should carry a plain-text status line: the reporting month, the last refresh time, and the pipeline status. People stop trusting a report the first time it is silently wrong. A visible "stale since Tuesday" keeps that trust intact.
Rule 2: Blank, never zero
A zero on a safety dashboard means "no recordable incidents". If no hours were logged that month, the honest answer is "not measured". The same applies to client satisfaction with no survey, a scorecard category with no inputs, or a completion percentage when the inputs are invalid.
In practice:
- Write measures so that "no rows" returns blank, not 0. In DAX that usually means not wrapping results in
+ 0orCOALESCE(..., 0)by default. - For composite scores, compute a coverage % showing how much of the score is backed by real data, and a measured-only version that divides by coverage so partly measured projects compare fairly.
- For history, months before snapshots began should read "unavailable", not zero.
This rule also makes gaps actionable. If a scorecard shows 71% coverage, everyone can see that the remaining 29% depends on inputs nobody has entered yet.
Rule 3: Flag, never drop, with a rejects table
Validation that deletes bad rows hides problems. Validation that routes bad rows to a rejects table, with the rule name, the source, the load timestamp and the raw payload, turns every failure into something you can count, trend and fix.
Keep raw payloads in bronze. When a transformation rule was wrong, you fix the logic and re-run from bronze instead of re-extracting from the source API.
Rule 4: Build an unresolved-records worklist
A rejects table is for engineers. An unresolved-records worklist is for the business. Each row should answer four questions:
- What is wrong? Category and reason: project not in accounting, AP invoice not assigned to a job, AR invoice unmatched, trade label unmapped.
- Where? The project and source system.
- How much money does it carry? The amount, counted once, so the total is not double counted across categories.
- Where do I fix it? A "Fix in" column naming the system: Procore, Sage, the scheduler, or a SharePoint list.
Rows should drop off automatically on the next run once fixed at source. Never patch numbers in the report layer; fix it at the source so every downstream consumer gets the correct value. Where matching is fuzzy, such as linking a PM-system project to an accounting job, suggest a match for a person to confirm rather than auto-assigning it.
Rule 5: Check cross-system coverage for every project
For each project, check presence in every system that should know about it. A simple coverage page shows projects fully mapped, missing from accounting, and missing from the scheduler, plus an overall coverage %.
Some gaps are expected. A pursuit may exist in the scheduler before it is created in the PM system. The point is not zero gaps; it is that every gap is visible and explained, so nobody reads a missing accounting setup as zero revenue.
Rule 6: Maintain a version-controlled cost-code crosswalk
Cost codes drift: an ERP migration, a new standard, a division restructure, or a PM system that uses a different format. Reporting across them needs an explicit mapping, not a lookup someone maintains in a spreadsheet tab.
- Store the cost-code master and old-to-new maps as seed files in version control.
- Map every source code to one reporting structure (division, then cost code).
- Measure how much budget maps cleanly, and list cost codes that appear in transactions but not in the master.
- Run a parse check on division prefixes, so a malformed code is caught rather than grouped into the wrong division.
The same pattern applies to project crosswalks (PM project to accounting job) and vendor mappings.
Rule 7: Reconcile independent sources, never add them
When two systems measure the same thing, use one as the reporting figure and the other to check it. Comparing PM-system spend to accounting AP job cost by project surfaces missing commitments, unposted invoices and cost the PM system cannot see. Adding them together double counts.
Related traps worth their own rules:
- Running balances. Pay-application fields such as retainage held and billed to date are cumulative. Read them from each contract's latest issued or approved pay app only. See retainage.
- Repeated monthly values. Contract totals that repeat each month must take the latest month per project, not a sum.
- Coverage vs currency. "Vendor has no insurance certificate" and "certificate has lapsed" are different problems with different follow-up. Count them separately.
Rule 8: Snapshot balances on every passing run
Many source systems only know "as of now". If you want a month-end submittal backlog or AR balance trend, you must capture it at the time. Save point-in-time balances on each run that passes the gate. Trends then reflect what was actually true, and months before snapshots began show as unavailable rather than invented.
Checklist: implementing data-quality rules in your reporting
- Inventory sources. List every system and spreadsheet feeding the report, and who owns each.
- Move untracked data into structured inputs. Replace free-form spreadsheet tabs with versioned lists (we use SharePoint lists) so manual inputs have an audit trail.
- Land raw data with load stamps. Keep payloads as received.
- Type and validate in a clean layer. Route failures to a rejects table with a reason.
- Build crosswalks as code. Projects, cost codes, vendors and trades, all in version control.
- Write the rules. Start with row counts, key uniqueness, referential integrity, date inversions, coverage and reconciliation variance. Classify each as blocking or warning.
- Gate the refresh. Semantic models refresh only on a passing run.
- Snapshot on pass. Save month-end balances and backlogs.
- Publish the worklist. One page, one row per unresolved record, amount and "Fix in".
- Show status everywhere. Last refresh and pipeline status on every page.
- Assign owners and a cadence. Someone reviews the worklist weekly; fixes happen at source.
Common mistakes
- Validating after publishing. If checks run after the refresh, the wrong number has already been seen and exported.
- Defaulting blanks to zero. It makes dashboards look complete and quietly makes them wrong.
- Fixing data in the report. Manual overrides in Power BI or Excel break the link to source and get overwritten next month.
- One giant "data issues" count. Without a reason, an owner and a "Fix in" system, nobody acts on it.
- Summing cumulative fields. Retainage and billed-to-date are the classic examples.
- Combining systems instead of reconciling them. Two views of the same cost are a check, not a total.
- Treating every rule as blocking. If minor warnings stop the refresh, the report is always stale and people go back to spreadsheets.
How we approach it
We built this rule set into a reporting platform for a general contractor that replaced a hand-filled monthly progress workbook and a 44-sheet QA/QC workbook. Procore, Sage 100 Contractor, Outbuild and 17 SharePoint lists feed a bronze, silver and gold lakehouse in Microsoft Fabric. About 200 automated rules run nightly. A blocking failure stops publication, so a bad night leaves the previous correct numbers in place.
The reports include a Source Coverage page (projects mapped across Procore, Sage and the scheduler), a Data Quality page (pipeline status, blocking violations, unmatched invoices, crosswalk gaps, inverted milestone dates) and an Unresolved Records worklist that names the system to fix each record in. Cost codes from three coding schemes map to one structure through version-controlled tables. Procore spend is reconciled against Sage AP job cost without ever being added to it, and retainage is read from the latest issued or approved pay app. The project scorecard shows blank, not zero, for unmeasured categories, with coverage % alongside. In the walkthrough, coverage sat at 71% because the remaining 29% depends on manual inputs from SharePoint lists the team had not yet filled in.
You can see every page in the construction project reporting showcase, or read how the Fabric platform was built. The same principles carry over to QuickBooks-based stacks, as in our Procore, QuickBooks and HubSpot reporting example, and they sit underneath WIP reporting too. The full list of principles is on our approach page.
Where to go next
- Watch the Procore + Sage + Outbuild reporting walkthrough to see the gate, coverage page and worklist in a live report.
- Read the playbook for replacing the monthly Excel report.
- Explore the Fabric lakehouse guide for contractors.
- If your reports need numbers people can defend, tell us what you want to build.
Frequently asked questions
What is a data quality gate in construction reporting?
A data quality gate is a set of automated checks that runs after data is transformed and before reports refresh. If a blocking rule fails, the refresh is stopped and the report keeps showing the last correct numbers with a stale status. Non-blocking warnings still publish but flow into a worklist for follow-up.
Why should missing data show as blank instead of zero?
Zero is a measurement and blank is the absence of one. If a safety metric shows zero incidents because nobody logged hours, the report is claiming a good result it never measured. Showing blank or Not measured, with a coverage percentage, makes the gap visible so someone fills it.
How do you reconcile Procore and Sage job costs?
Use one system as the reporting figure and the other as a check. Compare Procore spend to Sage AP job cost by project and report the variance, but never add the two together, which would double count. Unassigned AP invoices and projects missing from either system go to an unresolved-records worklist.
What is a cost-code crosswalk?
A cost-code crosswalk is a mapping table that translates codes from different systems or older coding schemes into one reporting structure. Keeping it in version control makes changes reviewable, and measuring how much budget maps cleanly shows when the crosswalk needs attention.
How many data quality rules does a construction report need?
It depends on the number of sources and metrics. Start with row counts, key uniqueness, referential integrity, date inversions, cross-system coverage and reconciliation variance, then add rules as you find failure modes. Our multi-source Fabric reporting platform runs about 200 rules nightly.
Where should data problems be fixed: in the report or in the source system?
In the source system. Overrides in Power BI or Excel break the link to source and get overwritten on the next refresh. A worklist that names the system to fix each record in lets the fix flow through to every report automatically.
Next step
Have a problem like this?
Tell us the outcome you need. We'll tell you honestly how we'd approach it, and reply within two business days.
Keep learning
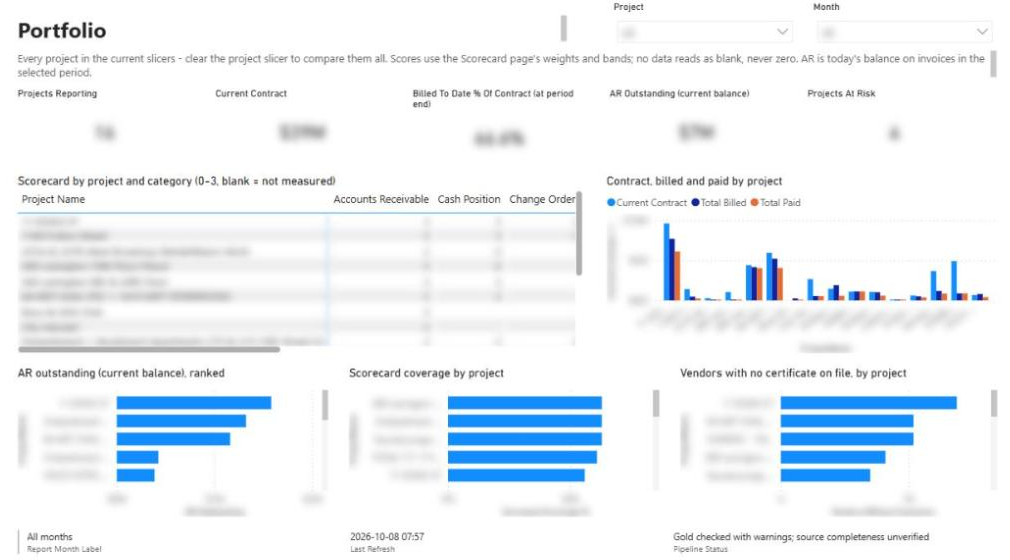
Reporting & analytics · October 8, 2026
Construction Project Reporting: Solution Showcase
Two Power BI reports—22 pages and ~180 measures—that replaced a general contractor's hand-filled monthly progress and QA/QC workbooks. Computed nightly from Procore, Sage 100, Outbuild, and SharePoint, and published only after ~200 data-quality rules pass.
Reporting & analytics · October 7, 2026
How We Built Construction Reporting in Microsoft Fabric
The engineering behind a nightly Procore + Sage + Outbuild reporting platform in Microsoft Fabric: medallion lakehouse, cost-code mapping, a quality gate, and building it with Claude and MCP servers.
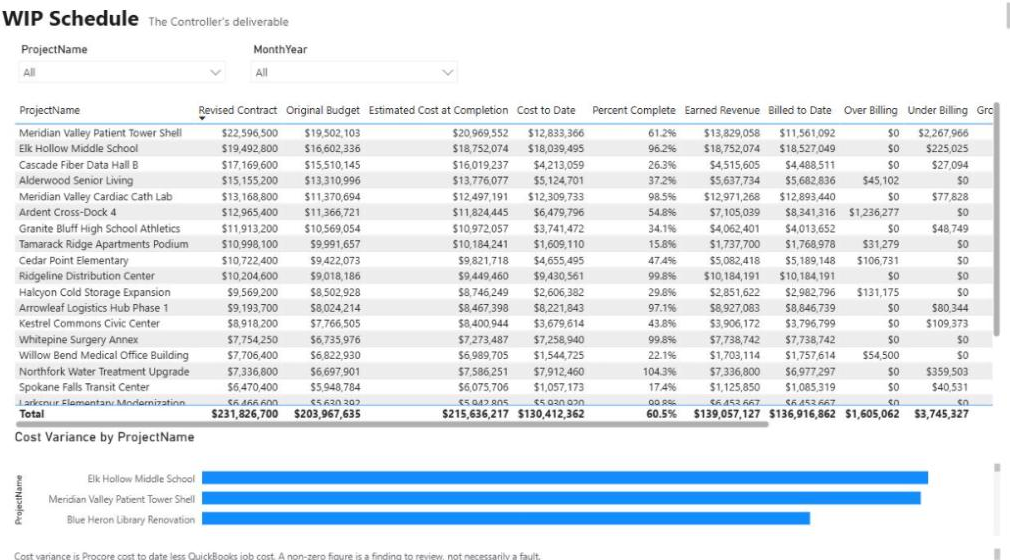
Reporting & analytics · October 8, 2026
Construction WIP Reporting in Power BI: A Controller's Guide
A practical guide to construction WIP reporting in Power BI: the formulas, where the data comes from in Procore and accounting, the mistakes that make a WIP schedule look right while being wrong, and how to automate it.