At a glance: 3 systems (Procore, QuickBooks Online, HubSpot) · 10 report pages · ~50 data-quality checks before every refresh · one view of contracts, WIP, cost, cash, pipeline, and labor.
The Financial Operating System is a 10-page Power BI report that gives a construction company's owners and controller one view of contracts, WIP, cost, cash, pipeline, and labor. It combines Procore, QuickBooks Online, and HubSpot. Screenshots are from a demo build loaded with sample data for a fictional contractor: about 20 projects and $232M of contract value. The demo uses Procore and QuickBooks; the HubSpot page is described but not pictured.
How Procore, QuickBooks and HubSpot fit together
Each system answers a different question: Procore holds the job forecast, QuickBooks holds the money, and HubSpot holds the work not yet won. A nightly pipeline in Microsoft Fabric pulls all three through their APIs and joins them on one project list.
| System | What is pulled | What it drives in the report |
|---|---|---|
| Procore (project management) | Projects, cost codes, budgets, prime contracts and change orders, pay applications, commitments, purchase and work orders, commitment change orders, direct costs, requisitions | Contract value, estimated cost at completion, cost to date, committed cost, billed to date, change orders: the backbone of the WIP schedule |
| QuickBooks Online (accounting) | Customers and jobs, vendors, invoices, bills, payments, credit memos, deposits, journal entries, time activities, GL, P&L detail, AR aging | AR and AP aging, the cash forecast, an independent cost check against Procore, and labor hours for capacity |
| HubSpot (CRM) | Deals, pipelines and stages, companies, contacts, line items, owners | Pipeline value, weighted pipeline, open deals, and pipeline confidence |
How the systems are joined
The three systems share no common ID, so a project crosswalk links each Procore project to a QuickBooks customer/job and a HubSpot deal. It applies three rules in order:
- Controller's list wins. A short manual mapping file overrides everything.
- Exact match. The Procore project number found in the QuickBooks job name.
- Cautious name match. A fuzzy match is used only at 80% or higher confidence and only when there is a single candidate.
Projects that don't match stay in the totals, flagged as unmapped, and appear on the Exceptions page for review.
What the pipeline guarantees
- Won work enters through Procore. HubSpot deals are never added to backlog or called revenue; "total forward work" shows backlog and weighted pipeline side by side.
- Procore cost to date is compared with QuickBooks job cost, and the difference is shown as cost variance: a finding to review, not necessarily an error.
- Data lands raw (bronze), is typed and validated (silver), then modeled as a star schema (gold). About 50 data-quality checks run before refresh; a blocking failure stops it.
- The WIP table keeps one snapshot per month, so month-end figures stay as reported.
- The connectors are modular: a client can start with Procore and QuickBooks and add HubSpot later, as the demo does.
Report pages
Every page has Project and Month slicers and a one-line subtitle saying who it is for. Headline figures below are from the demo company's sample data.
1. Portfolio: every project at once
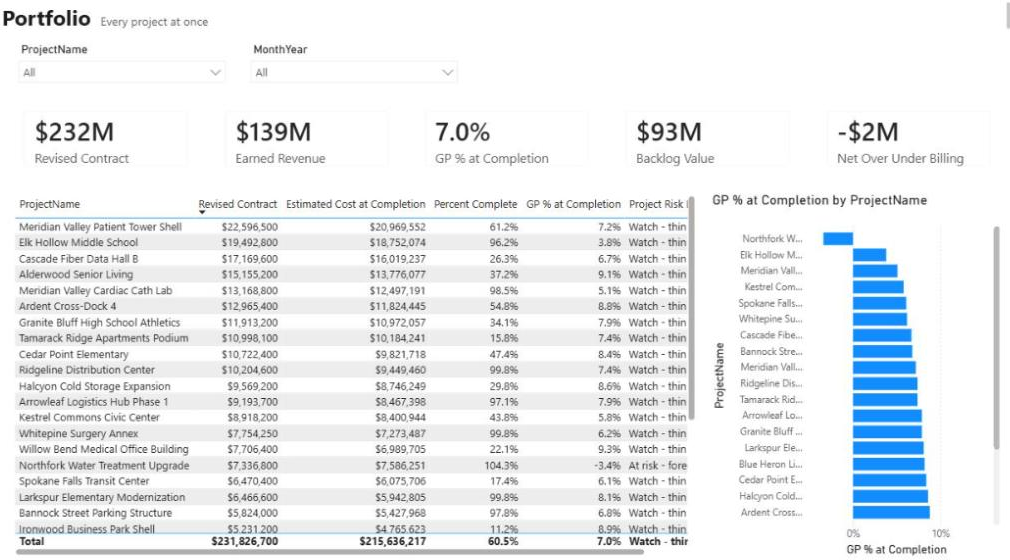
- Example figures: $232M revised contract, $139M earned revenue, 7.0% GP at completion, $93M backlog, −$2M net over/under billing.
- Visuals: a project table (revised contract, estimated cost at completion, % complete, GP % at completion, risk label) and GP % at completion by project.
- Source: Procore contracts and forecasts.
2. Executive KPI: the one-page answer
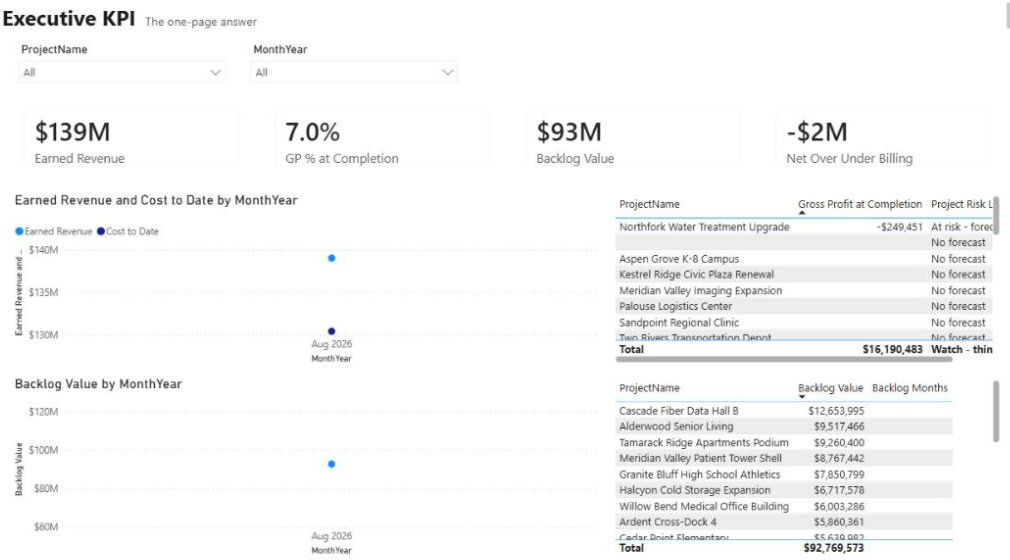
- Example figures: earned revenue, GP % at completion, backlog value, net over/under billing.
- Visuals: earned revenue vs cost to date by month, backlog value by month, gross profit at completion and risk label by project, backlog value and backlog months by project.
3. WIP Schedule: the controller's deliverable
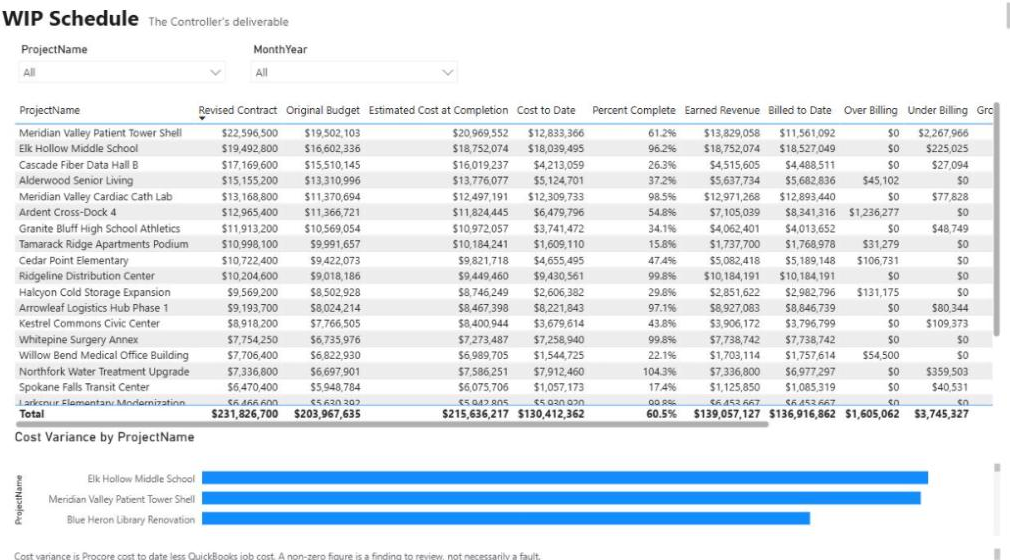
- Columns: revised contract, original budget, estimated cost at completion, cost to date, % complete, earned revenue, billed to date, over billing, under billing, gross profit.
- Example totals: $130M cost to date, $137M billed, $1.6M over-billed, $3.7M under-billed.
- Cross-check: cost variance by project, meaning Procore cost to date minus QuickBooks job cost.
- Sources: Procore and QuickBooks together.
4. Project Financial Performance: per-project drill-down
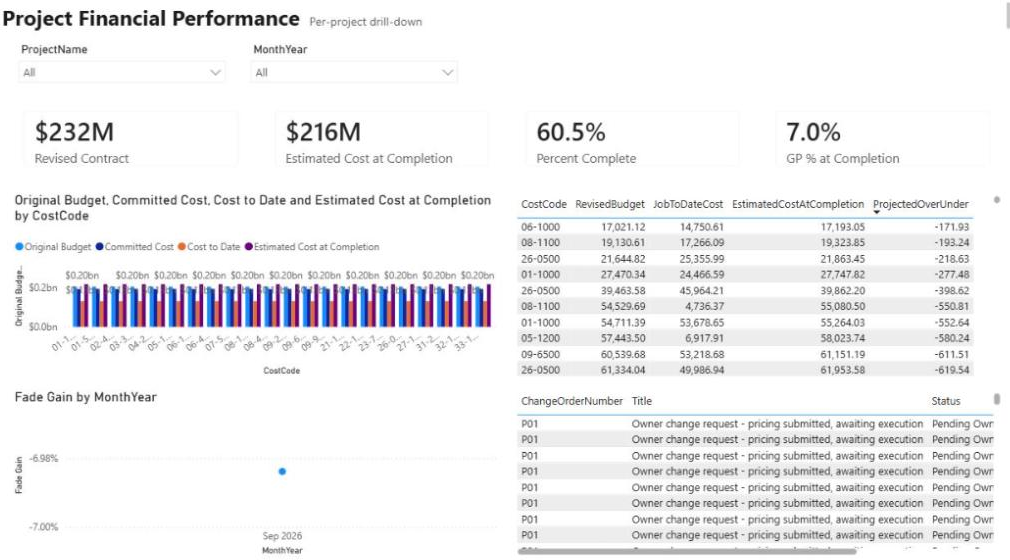
- KPIs: revised contract, estimated cost at completion, % complete, GP % at completion.
- Visuals: original budget vs committed vs cost to date vs EAC by cost code, projected over/under by cost code, fade/gain by month, change-order log with status.
5. Backlog & Burn: work in hand and how fast it is consumed
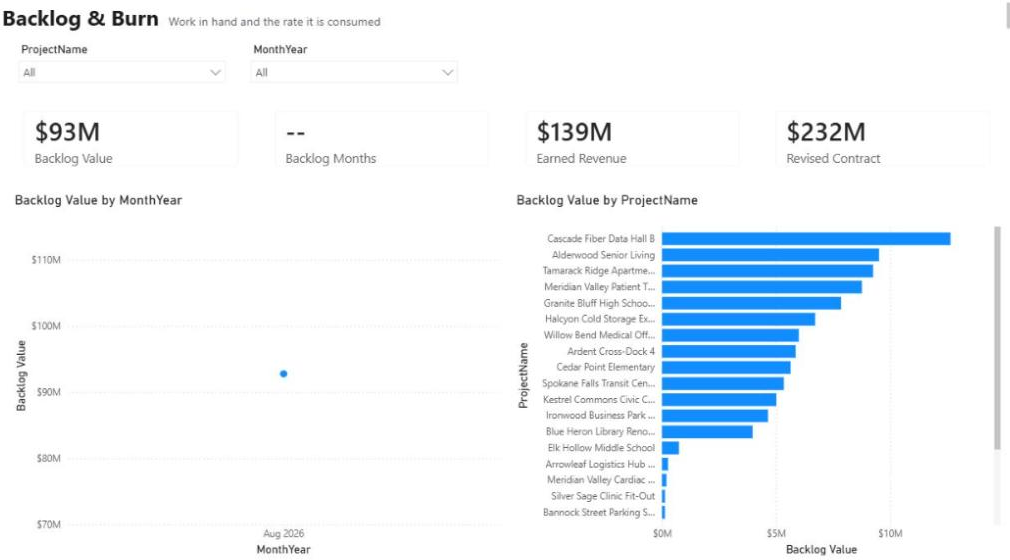
- KPIs: backlog value ($93M), backlog months, earned revenue, revised contract.
- Visuals: backlog by month and by project.
6. Exceptions: what needs attention, in one place
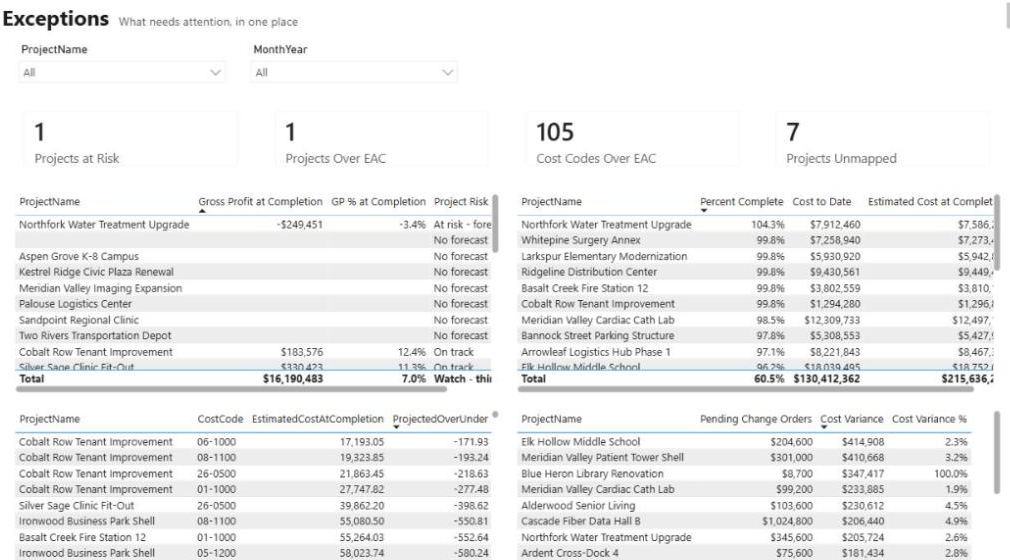
- Example counts: 1 project at risk, 1 project over its estimate at completion, 105 cost codes over estimate, 7 projects not yet mapped across systems.
- Visuals: lists of projects by GP and risk, projects near or past 100% complete, cost codes projected over, and pending change orders against cost variance.
7. Pipeline & Forecast: work we might win (HubSpot)
The demo company runs Procore and QuickBooks only, so this page is not in the demo build. It switches on when HubSpot is connected.
- KPIs: pipeline value, weighted pipeline, open deals, pipeline confidence.
- Visuals: pipeline and weighted pipeline by deal stage, weighted pipeline next to backlog by month, pipeline by deal owner, and an open-deal list with stage, amount, close date, and days open.
- Source: HubSpot.
8. AR & Collections: the chase list
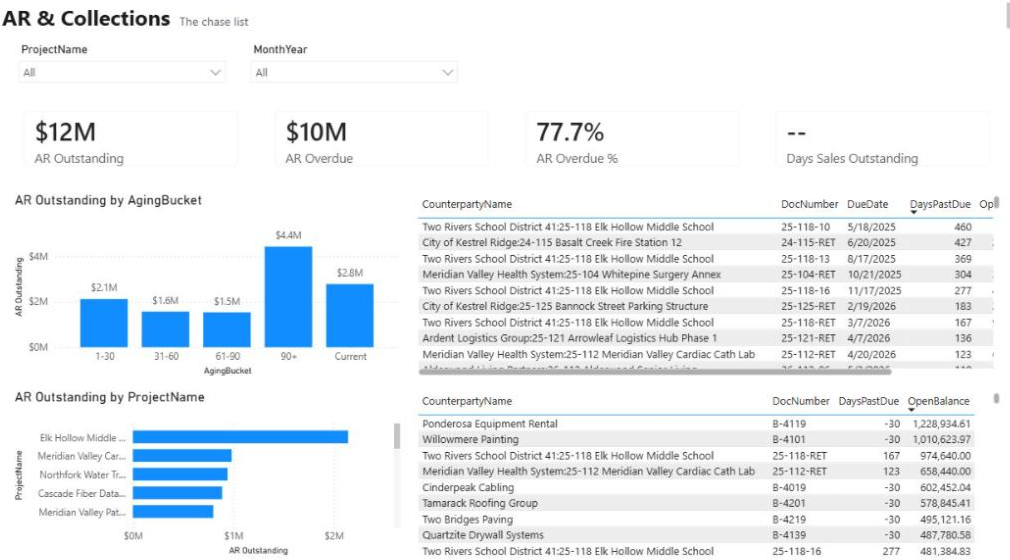
- Example figures: $12M AR outstanding, $10M overdue (77.7%), days sales outstanding.
- Visuals: AR by aging bucket (current, 1–30, 31–60, 61–90, 90+), AR by project, overdue invoices with days past due, largest open balances.
- Source: QuickBooks.
9. Cash Forecast: committed cash only
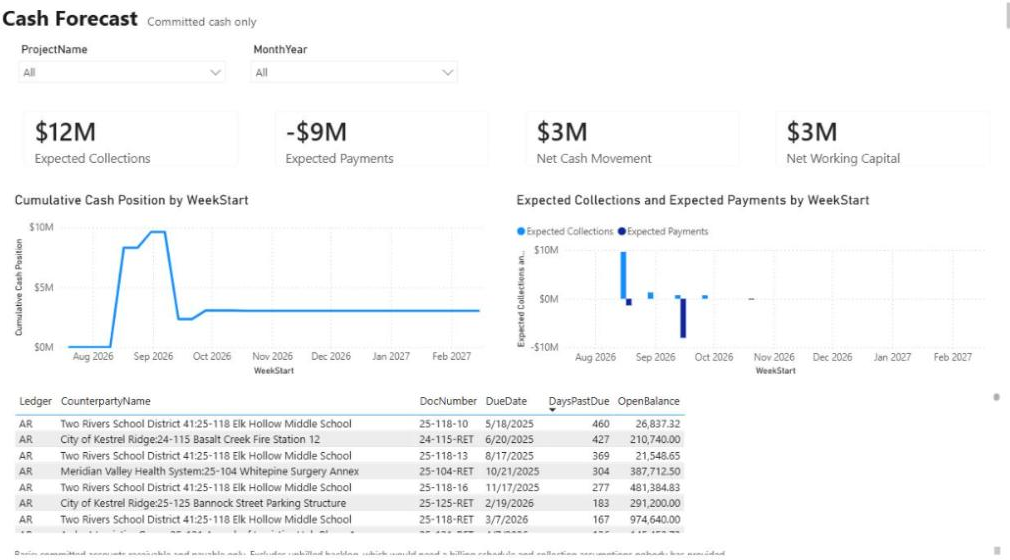
- Example figures: $12M expected collections, −$9M expected payments, $3M net cash movement, $3M net working capital.
- Visuals: cumulative cash position by week, collections vs payments by week, and the open AR/AP items behind them.
- Source: QuickBooks invoices and bills.
10. Capacity: hours, utilization and labor margin
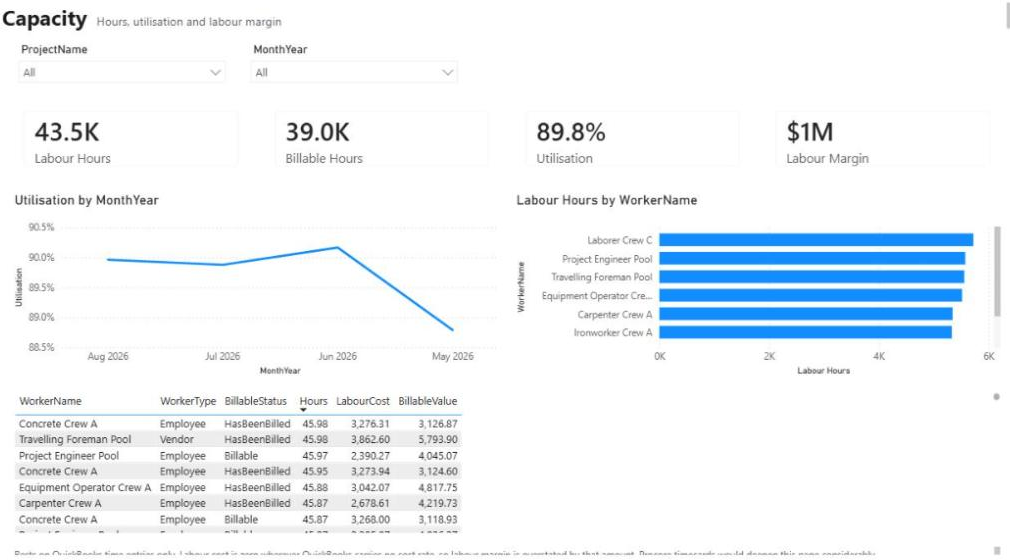
- Example figures: 43.5K labor hours, 39.0K billable, 89.8% utilization, $1M labor margin.
- Visuals: utilization by month, hours by crew, and a time-entry table with worker type, billable status, cost, and billable value.
- Source: QuickBooks time entries.
Metrics tracked
The key figures follow standard construction WIP accounting (cost-to-cost percent complete), so the report ties to what a controller already prepares.
| Metric | Definition | Source |
|---|---|---|
| Revised contract | Original contract + approved change orders; pending change orders shown separately as exposure | Procore |
| Percent complete | Cost to date ÷ estimated cost at completion, capped at 100% | Procore |
| Earned revenue | Revised contract × percent complete, summed project by project | Procore |
| GP % at completion | (Revised contract − estimated cost at completion) ÷ revised contract | Procore |
| Project risk label | No forecast if blank; At risk if GP % below 0; Watch if below 10%; otherwise On track | Procore |
| Over / under billing | Billed minus earned when positive (over), earned minus billed when positive (under); net shown as one figure | Procore |
| Fade / gain | Month-on-month change in GP % at completion | Procore |
| Cost variance | Procore cost to date minus QuickBooks job cost, by project | Procore + QuickBooks |
| Backlog value / months | Revised contract − earned revenue; months = backlog ÷ average earned revenue over the last 3 months | Procore |
| AR outstanding / overdue / aging | Open invoice balances, overdue share, and 30-day aging buckets | QuickBooks |
| Expected collections / payments | Issued AR invoices and AP bills placed in the week they fall due, 4 weeks back to 26 ahead; overdue items roll into the current week | QuickBooks |
| Net cash movement / cumulative cash position | Collections minus payments, and its running total by week; unbilled backlog excluded | QuickBooks |
| Utilization | Billable hours ÷ total labor hours | QuickBooks time |
| Labor margin | Billable value minus labor cost | QuickBooks time |
| Pipeline / weighted pipeline | Open deal amounts; weighted = amount × probability (the deal's own, else the stage's) | HubSpot |
| Pipeline confidence | Weighted pipeline ÷ total pipeline | HubSpot |
| Projects unmapped / over EAC / cost codes over EAC | Exception counts that drive the review list | All three |
Where this fits
This is the right-sized version of our enterprise reporting build on Procore, Sage, and Outbuild: the same bronze → silver → gold pipeline, quality gate, and "flag, never drop" rules—scoped to a contractor running cloud accounting and a CRM. Start with two systems, add the third when you're ready.
Next step
Have a problem like this?
Tell us the outcome you need. We'll tell you honestly how we'd approach it, and reply within two business days.
Keep learning

Integrations · August 18, 2026
How We Joined Procore, QuickBooks and HubSpot in Microsoft Fabric
A build walkthrough of the pipeline that joins Procore projects, QuickBooks jobs and HubSpot deals in Microsoft Fabric, including the crosswalk that refuses to guess and the gate that stops wrong numbers.
Reporting & analytics · October 8, 2026
Construction WIP Reporting in Power BI: A Controller's Guide
A practical guide to construction WIP reporting in Power BI: the formulas, where the data comes from in Procore and accounting, the mistakes that make a WIP schedule look right while being wrong, and how to automate it.
Integrations · October 8, 2026
Procore API Integration Guide: Patterns, Crosswalks and Governance
A practical guide to connecting Procore with accounting, scheduling, BI and CRM systems: which pattern to use, how to link projects across systems, and how to keep the numbers trustworthy.