Short answer: Construction data maturity runs through five stages: spreadsheet-driven (work runs on spreadsheets, email and memory), connected (the main systems are linked for some flows), governed (data has owners, agreed definitions and checks), automated (routine flows, approvals and reports run on their own) and intelligent (governed AI and forecasting work on trusted data). Most contractors sit in stage 1 or 2. What to fix first is almost always the weakest of six areas: systems and integration, reporting, data quality and definitions, workflow automation, AI readiness, and ownership. A company is only as mature as its weakest link, so a strong BI report on top of re-keyed, unowned data is still an early-stage setup.
This guide describes each stage in terms an operations leader or CFO will recognize, explains how to tell which one you are in, and gives the first move out of each. It uses the same stages, dimensions and scoring as our free data and automation maturity assessment, which takes about five minutes and produces a 90-day roadmap you can take to your leadership team.
Why a maturity model helps
Most technology roadmaps in construction start with a product: a new BI tool, an AI pilot, a data warehouse. The product is rarely the constraint. The constraint is usually something less visible, such as job numbers that differ between systems, a WIP schedule nobody can trace, or an integration that fails silently until month end.
A maturity model is a way to find that constraint before you spend money on the layer above it. It also gives leadership a shared vocabulary. "We are connected but not governed" is a more useful sentence than "our data is a mess."
The five stages
| Stage | Name | What it looks like |
|---|---|---|
| 1 | Spreadsheet-driven | Work runs on spreadsheets, email and memory. Reports are rebuilt by hand and numbers are re-typed between systems. |
| 2 | Connected | The main systems are linked for some flows, but reporting still needs manual assembly and definitions vary by person. |
| 3 | Governed | Data has owners, agreed definitions and checks. Leadership trusts the reports enough to act on them. |
| 4 | Automated | Routine flows, approvals and reports run on their own. People handle exceptions instead of moving data. |
| 5 | Intelligent | Governed AI and forecasting work on trusted data, so problems surface early and routine decisions are assisted. |
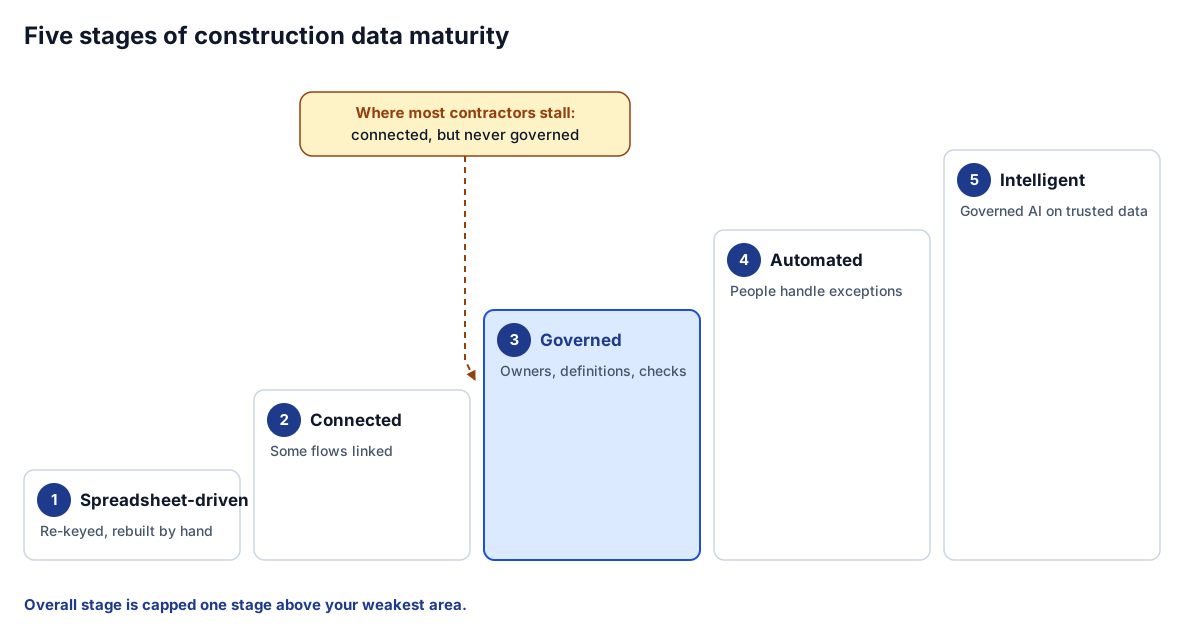 The five stages. The step from connected to governed is the one most often skipped.
Stage 1: Spreadsheet-driven
Signs you are here: the WIP or monthly job report is rebuilt in Excel and takes days. Commitments and change orders are re-typed from a PDF or email into the ERP. A new job is set up by hand in three or four systems. When an executive questions a margin, someone goes away to build a separate spreadsheet.
What it costs: hours every week, and decisions made on numbers that are already a few weeks old. The bigger risk is invisible: two people calculate the same metric differently and nobody notices until a lender or surety asks.
First move out: map every place data is re-keyed, rank the re-keys by hours and errors, and connect the worst one. Usually that is commitments, change orders or AP between the PM system and the ERP. Our guide on how to choose your first construction integration gives a scoring method.
Stage 2: Connected
Signs you are here: an integration moves most commitments or invoices, with regular manual fixes. There is a BI report, but it still needs manual inputs each month. Job numbers and cost codes are mostly consistent, held together by a crosswalk spreadsheet that one person maintains. Margin and percent complete are calculated mostly the same way, but it is not written down.
What it costs: less re-keying, but not much more trust. Reports still start arguments, and integration failures are often found at month end.
First move out: write down the definitions and add checks. Agree, in writing, how margin, cost to complete and percent complete are calculated, including what a blank value means. Then turn the recurring data checks into rules that run before every report refresh. This is the step most contractors skip on the way to dashboards and AI, and it is the reason those projects disappoint. See construction data quality rules for the rules we use.
Stage 3: Governed
Signs you are here: each key dataset (jobs, cost codes, vendors, commitments, schedule) has a named owner. Every report uses the same written calculation. Bad records are caught by rules and routed to the person and system where they get fixed. If a number changes overnight, you can usually trace why.
What it unlocks: leadership acts on the reports instead of questioning them. This is the foundation that automation and AI need.
First move out: automate the routine. Pick the approval that waits longest, usually AP invoices or change orders, and route it by rules with reminders. Move the monthly report to a refreshed model so month end becomes a review, not a build. Trigger job setup from the won deal or estimate.
Stage 4: Automated
Signs you are here: most recurring admin tasks run on their own, monitored, with failures reported. Approvals are routed by rules and only exceptions need a person. Leadership sees current job cost and forecast weekly or daily, and can drill from portfolio to job to cost code.
What it unlocks: people spend their time on exceptions and decisions instead of moving data. You also now have the clean, governed access that AI needs.
First move out: give AI governed access to real systems. Expose read access to ERP and PM data through one controlled layer rather than copy and paste, log every question and tool call, and add write actions only behind a human approval step. Our guide to governing AI agents in construction covers the controls.
Stage 5: Intelligent
Signs you are here: AI runs in at least one live workflow with measured results, under a written policy that is enforced in the tools, with usage logged. Forecasting and early-warning indicators work on the same governed data as the reports, so problems surface before month end.
What to watch: stage 5 does not stay stage 5 on its own. Access reviews, data owners and checks still need attention, or the foundations erode under the AI layer.
The six areas that set your stage
Your stage is not one score. It is the combination of six areas, each of which can be at a different level.
| Area | What a gap looks like | First fix when weak |
|---|---|---|
| Systems and integration | Commitments, change orders and new jobs re-typed between systems | Map every re-key, then connect the worst one |
| Reporting and visibility | Monthly or WIP report rebuilt by hand; drill-down means another spreadsheet | Cost the monthly report, then replace it |
| Data quality and definitions | People calculate margin differently; bad records found when a report looks wrong | Run a data quality check on one export |
| Workflow automation | Approvals chased by email and phone; setup steps depend on memory | Automate one approval path end to end |
| AI readiness | Staff use public chat tools on company data; no rules | Pick one AI pilot with a measurable job |
| Ownership and governance | Nobody owns job and cost data; access rarely reviewed | Name an owner for every key dataset |
Each area has its own useful tool: the stack mapper for systems, the monthly report cost calculator for reporting, the data quality checker for data, the AI pilot worksheet for AI readiness, and the reporting readiness checklist for ownership.
How the assessment scores you
Our maturity assessment asks 18 concrete questions, three per area. Each question has four answers, scored 0 to 3 in order, from "someone re-types it from a PDF" to "it syncs automatically and failures alert someone the same day."
- Area score: the average of the area's answers as a percentage of the maximum.
- Area stage: every 20 percentage points is one stage: below 20% is stage 1, 20% to 39% is stage 2, and so on up to stage 5 at 80% and above.
- Overall stage: the stage of the average across all six areas, capped at one stage above your weakest area.
The cap is deliberate. If your reporting and workflow areas score at stage 4 but data quality is at stage 2, the reports are fast and the approvals are smooth, but the numbers underneath are not trusted. The assessment will place you at stage 3 at most, and data quality will be at the top of your roadmap.
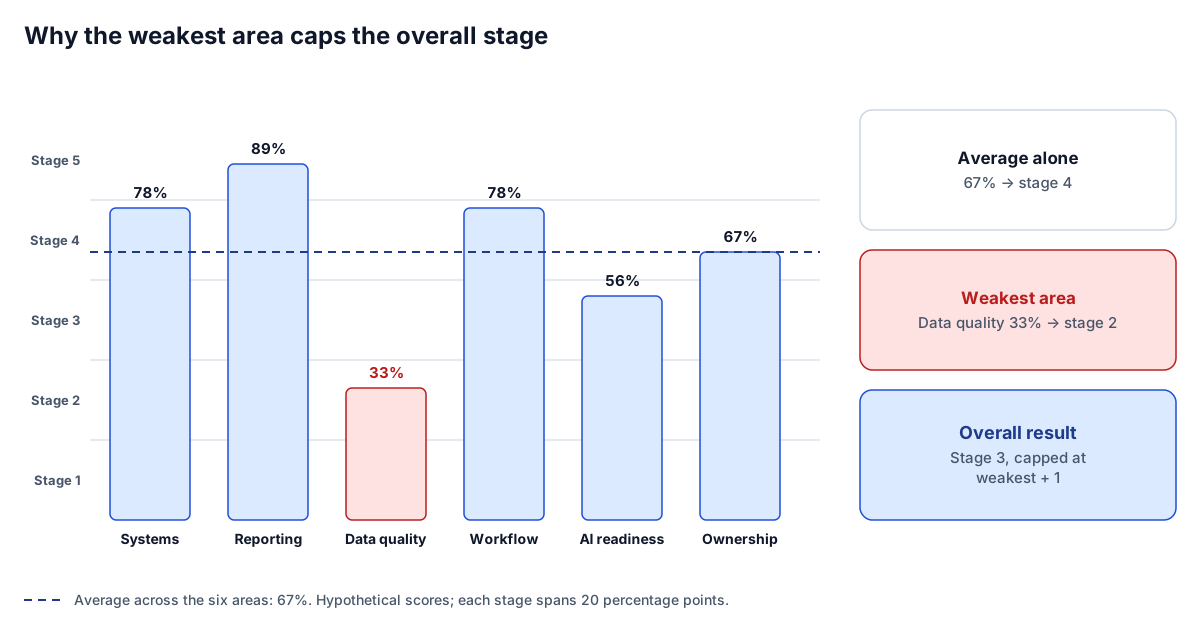 A strong average cannot outrun the weakest area: the overall stage is capped one above it.
What to fix first
The rule is simple: fix the lowest-scoring area first, and when two areas tie, fix the more foundational one. The order we use is systems, then reporting, then data quality, then workflow, then AI, then ownership. That matches how the work builds on itself: you cannot report on data that is still re-typed, you cannot govern a report that does not exist, and you should not automate or add AI on top of numbers nobody trusts.
For each of your three weakest areas, the move depends on how weak it is:
- Below 50%: do the foundational move from the table above, such as mapping re-keys or naming dataset owners.
- 50% or more: do the next move up, such as pricing the next integration before you build it, writing down metric definitions and automating the checks, or giving AI governed access to your real systems.
Three moves is about what a contractor can complete in 90 days alongside running jobs. Do them, re-take the assessment, and see which area is now the constraint.
Common traps
- Buying stage 5 first. An AI assistant on top of re-keyed, unowned data gives confident answers to the wrong numbers. Get the data governed first.
- Treating a BI tool as stage 3. Dashboards are reporting. Governance is owners, definitions and checks. You can have the first without the second.
- Skipping ownership because it feels like admin. When nobody owns a dataset, nobody fixes it, and access granted years ago is still open after people leave.
- One big program. A maturity roadmap is a sequence of small, finished moves, each one measurable. A two-year transformation plan usually stalls in the first quarter.
Where to go next
- Find your stage: the free data and automation maturity assessment, with a printable 90-day roadmap.
- Build the governed foundation: construction data quality rules.
- Replace the monthly spreadsheet: the playbook for replacing the monthly Excel report.
- Want a second opinion on your roadmap? Tell us where you are today and we will tell you what we would fix first.
Frequently asked questions
What are the stages of construction data maturity?
Spreadsheet-driven, where work runs on spreadsheets and re-keying; connected, where main systems are linked for some flows; governed, where data has owners, definitions and checks; automated, where routine flows and reports run on their own; and intelligent, where governed AI and forecasting work on trusted data.
How do I know which stage my company is in?
Look at how the WIP or monthly report is produced, how commitments reach accounting, whether margin is calculated the same way by everyone, and who owns job and cost data. Our free maturity assessment asks 18 questions across six areas and places you on a stage with a 90-day roadmap.
Why is the overall stage capped by the weakest area?
Because the areas depend on each other. A fast BI report built on re-keyed, unowned data still produces numbers people argue about. Capping the overall stage one above the weakest area keeps attention on the real constraint.
Should we start with AI?
Only if your data is already governed. AI on top of re-keyed or undefined data gives confident answers to the wrong numbers. Most contractors get more from fixing integration, definitions and ownership first, then adding AI with governed access.
Next step
Want help running this playbook?
Bring the report or workflow. We'll help map the work behind it.
Prefer email? charley@buildflows.ai
Keep learning
Reporting & analytics · October 8, 2026
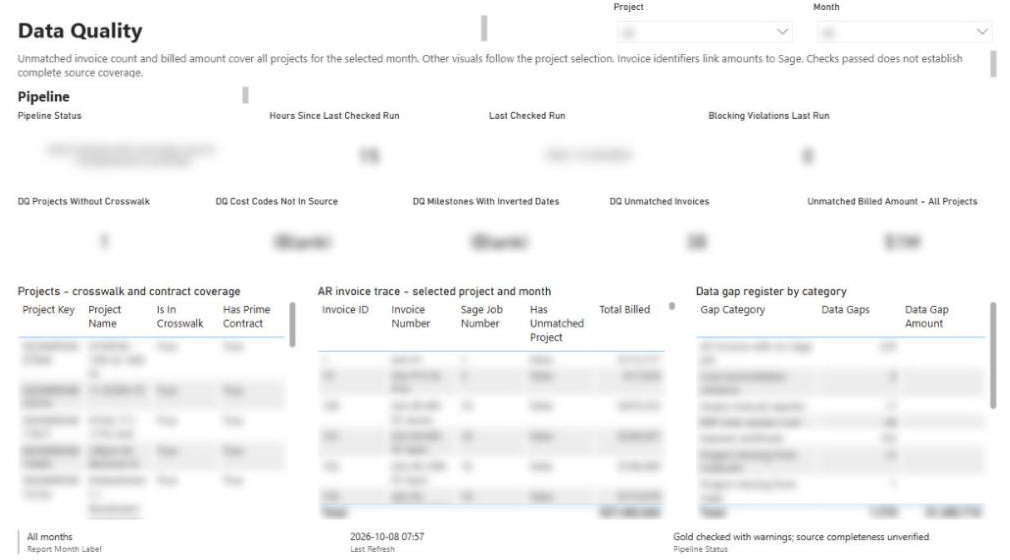
Construction Data Quality: The Rules That Make Reports Trustworthy
A practical checklist of the data-quality rules behind construction reports people can defend, from quality gates and blank-never-zero to cost-code crosswalks, reconciliation and snapshots.
Playbooks · October 8, 2026
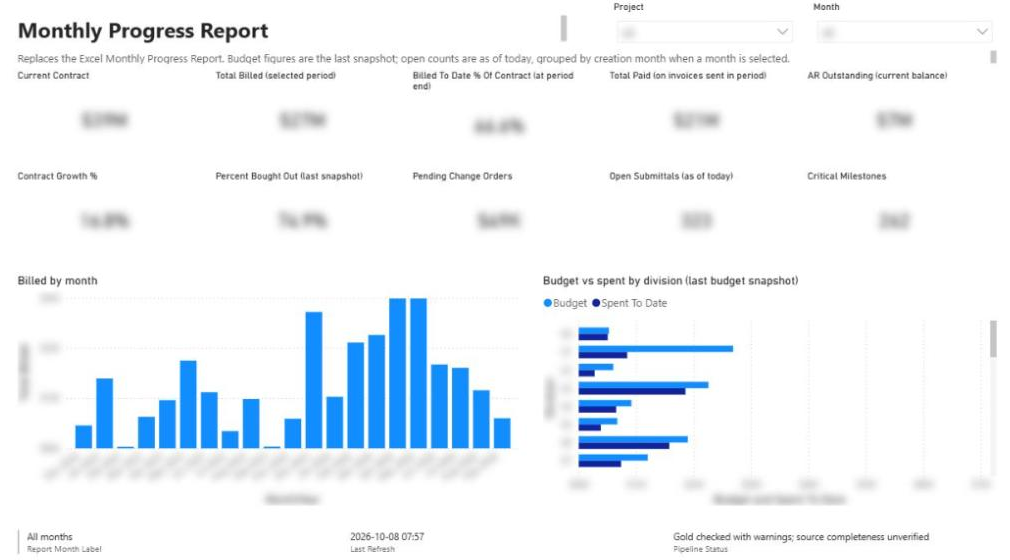
Playbook: Replacing the Monthly Excel Report for Contractors
A step-by-step program for retiring a contractor's hand-built monthly Excel report: inventory the workbook, map sources, give manual data a home, build crosswalks and a gated pipeline, pilot in parallel, then retire the spreadsheet.

AI agents & MCP · October 8, 2026
Governing AI Agents in Construction: A Checklist for IT and Leadership
A practical checklist for putting AI agents into construction systems safely, covering credentials, least privilege, read-first rollout, tool routing, telemetry, evaluation and human approval, drawn from our own builds.