Video unavailable? Watch on YouTube or read the written breakdown.
Short answer: A construction cash flow forecast in Power BI starts from money that is already committed: issued AR invoices and entered AP bills, each placed in the week it falls due, with overdue items rolled into the current week. Expected collections minus expected payments gives net cash movement per week, and its running total is your cumulative cash position. Everything less certain, such as projected billings from the schedule of values, slower-than-terms collections or upcoming subcontractor pay apps, goes on top as a separately labeled scenario with its assumptions written on the page. Retainage stays out of near-term collections until it is actually billed.
This guide is for controllers, CFOs and the people who build their reports. It is grounded in the cash forecast page of our Procore, QuickBooks and HubSpot report, a production implementation shown with sample data, and covers the model, the data sources, the weekly view, scenarios and the mistakes that make a cash forecast look precise while being wrong.
What a construction cash flow forecast has to answer
A contractor's cash question is rarely "what is our balance today?" Your bank tells you that. The questions that matter are forward-looking:
- Will we cover payroll and subcontractor payments in each of the next few weeks?
- Which week is the low point, and how low does it go?
- Which overdue receivables would change that low point if we collected them?
- How much of the forward view is committed, and how much is estimate?
Construction makes these harder than in most industries. Billing follows progress and a schedule of values, owners pay on their own approval cycles, a share of every invoice is held back as retainage, and subcontractor payments are often tied to when the owner pays you. A single forecast number hides all of that. A weekly view built from the items behind it does not.
Committed cash vs projected cash
The most useful design decision is to split the forecast into two layers and never blend them silently.
Committed cash is money with a document behind it: an issued invoice to an owner or an entered bill from a vendor or subcontractor. It has an amount, a due date and a counterparty. You may still be wrong about when it moves, but not about whether it exists.
Projected cash is money you expect but have not documented yet: next month's pay application, the remaining contract value on a job, payroll that has not been run, a change order still in negotiation. It depends on assumptions.
| Committed cash | Projected cash | |
|---|---|---|
| What it is built from | Open AR invoices and AP bills in accounting | Schedule of values, backlog, payroll runs, pending change orders |
| Timing basis | Invoice or bill due date | An assumption: billing cycle, days to pay, percent complete by period |
| Typical source | QuickBooks Online, Sage, or another accounting system | Procore pay applications and budgets, payroll, CRM pipeline |
| How certain | Amount is known; timing can slip | Amount and timing are both estimates |
| How to show it | The base forecast, drillable to each item | A labeled scenario layer with written assumptions |
Note the word clash: in job costing, committed cost means subcontracts and purchase orders you have signed. That is a cost commitment, not a cash commitment. A $1M subcontract becomes committed cash only when the sub bills against it. Keep the two terms apart in your report labels or someone will add them together.
In our Procore and QuickBooks build, the cash forecast page deliberately shows committed cash only. Unbilled backlog is excluded by design, because it has no invoice date or amount yet. The reasoning matches the build's quality gate, where a stale answer labeled as stale beats a fresh one that is wrong: a smaller number you can trace beats a bigger one you cannot.
How AR and AP timing works in the weekly view
The weekly view is where the forecast becomes something a controller can act on. In the built version, the rules are simple and written down:
- Pull open items. AR invoices, AP bills, payments and credit memos come from QuickBooks Online nightly through a read-only connection.
- Place each item by due date. An open invoice lands in the week it falls due as an expected collection. An open bill lands in the week it falls due as an expected payment.
- Roll overdue items forward. Anything past due is placed in the current week, because the cash has not moved and still could. Overdue items are not dropped and are not pushed into the past.
- Bound the horizon. Weeks run from four weeks back to 26 weeks ahead. Looking back shows recent movement; looking forward shows the committed runway.
- Compute the position. Net cash movement is expected collections minus expected payments per week. Cumulative cash position is the running total of net movement.
The page then shows cumulative cash position by week, collections versus payments by week, and the open AR and AP items behind every bar, alongside an AR aging and collections page.
A minimal version of the core measures in a Power BI semantic model looks like this, assuming an OpenItems table with a signed Amount, a Direction column (AR or AP) and a ForecastWeek that already applies the overdue roll-forward:
Expected Collections = CALCULATE ( SUM ( OpenItems[Amount] ), OpenItems[Direction] = "AR" )
Expected Payments    = CALCULATE ( SUM ( OpenItems[Amount] ), OpenItems[Direction] = "AP" )
Net Cash Movement    = [Expected Collections] + [Expected Payments]
Cumulative Cash Position =
    CALCULATE (
        [Net Cash Movement],
        FILTER ( ALL ( 'Week'[WeekStart] ), 'Week'[WeekStart] <= MAX ( 'Week'[WeekStart] ) )
    )
Here payments are stored as negative amounts so the net is a simple sum. Do the week placement upstream, in the pipeline, rather than in DAX. It keeps the rule in one place, makes it testable, and lets every report page agree.
Due date is a starting point, not a promise
Due date is the honest default because it is a fact on the document. Real payment behavior differs: some owners reliably pay late, and you may pay some vendors early for a discount or hold others until you are paid. Those adjustments are assumptions, so they belong in the scenario layer rather than quietly replacing the due date in the base forecast. If you want the base forecast to reflect history, compute average days-to-pay by customer from paid invoices and show it as a scenario you can switch on, not a hidden rewrite.
Handling retainage in a cash forecast
Retainage is the single most common reason a contractor cash forecast is too optimistic. If a $500,000 pay application carries 10% retainage, only $450,000 is due on normal terms. The other $50,000 is due at a milestone or at completion, often months later.
How to handle it:
- Separate retainage receivable from current receivables. Show it as its own line or measure so it never inflates the next few weeks of collections.
- Do the same for retainage payable. Retainage you hold on subcontractors is cash you will owe later. Leaving it out understates future payments.
- Only forecast retainage release when it is billed or scheduled. Until a release invoice exists, the timing is an assumption and belongs in a scenario.
- Confirm how your accounting system records it. Some teams use separate retainage items or accounts, others hold it inside the invoice. The forecast logic depends on which, so this is a discovery question, not something to guess.
Scenarios with explicit assumptions
Once committed cash is trusted, scenarios answer the "what if" questions. The rule we follow: every scenario states its assumptions on the page, in words, next to the numbers.
Useful scenarios for contractors:
- Projected billings. Next pay applications estimated from the schedule of values and percent complete, placed by your billing cycle and the owner's usual days to pay.
- Slow collections. Selected customers, or all customers, pay a set number of days after the due date.
- Subcontractor pay-when-paid. Sub payments shift to follow the related owner collection rather than the bill due date.
- Payroll and fixed costs. Known recurring outflows added by week, since payroll often runs outside AP.
- Pipeline. Weighted pipeline from the CRM, converted into an assumed start date and billing curve. This is the least certain layer and should be clearly marked as such.
Power BI's what-if parameters are a straightforward way to let a reader adjust a delay in days or a collection percentage and see the cumulative position move. Keep the base committed line visible at all times so the scenario is always read against it.
Data sources for a construction cash forecast
| Data | Usual source | Used for |
|---|---|---|
| Open invoices, payments, credit memos | Accounting (QuickBooks Online, Sage, other ERP) | Expected collections, AR aging |
| Open bills and vendor payments | Accounting | Expected payments, AP aging |
| Retainage receivable and payable | Accounting, sometimes Procore pay applications | Separating held-back amounts from near-term cash |
| Pay applications, schedule of values, budgets | Procore | Projected billings scenario, cross-check of invoicing |
| Contract and change orders | Procore | Remaining contract value for longer-range projection |
| Deals, stages, probabilities | CRM such as HubSpot | Pipeline scenario |
| Payroll and recurring costs | Payroll system or a structured manual input | Outflows not captured as AP bills |
Accounting is the right source for the committed layer because it records what was actually invoiced and paid. Procore is the right source for what will be billed. To combine them, you need a project crosswalk that links each Procore project to its accounting customer or job, because the systems share no common ID. In our build, unmapped projects stay in the totals, flagged for review, rather than disappearing.
For the plumbing, see how we land these sources in a lakehouse in Microsoft Fabric for contractors and the end-to-end pipeline in building the Procore, QuickBooks and HubSpot pipeline. If your accounting system is QuickBooks Online, Intuit's QuickBooks Online Accounting API documentation describes the invoice, bill and payment objects the forecast is built from.
Common pitfalls
- Blending committed and projected cash. One line that mixes invoices with estimates cannot be audited. Keep them as separate layers.
- Counting retainage as current. It makes the next few weeks look better than they are and moves the real low point.
- Dropping overdue items. An invoice 60 days late is still cash you expect. Roll it into the current week and flag it, rather than letting it fall off the chart.
- Treating committed cost as cash. Subcontract value is not a payment until it is billed.
- Ignoring outflows outside AP. Payroll, loan payments, taxes and insurance often never appear as bills. Add them as a labeled input or the forecast overstates cash.
- Silent manual overrides. If someone edits a date in a spreadsheet to "fix" the forecast, the next refresh either loses it or keeps a guess nobody can explain. Put overrides in a structured input with an owner and a reason.
- No snapshot. The forecast changes every night. Without saved snapshots, you cannot compare what you expected last month with what actually happened, which is the only way to improve the assumptions.
- No quality gate. Duplicate invoices, missing due dates or unmapped jobs should stop or flag a refresh before the numbers reach the owners' meeting. Our data quality rules guide covers the checks.
Cash forecast build checklist
Use this before you call the forecast trusted:
- Committed and projected cash are separate measures and separately labeled visuals
- Every open AR and AP item is placed by due date, with overdue items rolled into the current week
- The forecast horizon is stated on the page
- Retainage receivable and payable are shown separately from current balances
- Unbilled backlog is either excluded or shown only as a labeled scenario
- Every scenario lists its assumptions in plain words next to the chart
- Each weekly bar drills to the invoices and bills behind it
- Payroll and other non-AP outflows are included or explicitly noted as excluded
- Projects are joined across systems through a crosswalk, with unmapped items flagged, not dropped
- A quality gate runs before each refresh publishes
- Forecast snapshots are saved so you can compare expected with actual
- Open AR and AP totals reconcile to the accounting system's aging reports
How to measure whether it is working
Avoid judging a cash forecast by how sophisticated it looks. Measure it against a baseline:
- Preparation time. Hours spent assembling the cash view before each cash or owners' meeting, before and after.
- Forecast accuracy. Compare each saved weekly forecast with actual collections and payments for that week. Track the gap over time, separately for committed and scenario layers.
- Early warning. How many weeks ahead a low point was visible before it arrived.
- Collections focus. Whether overdue balances that move the low point are chased first.
If you want to put a number on the time side, the monthly report cost calculator runs in your browser with your own inputs.
How this fits with WIP reporting
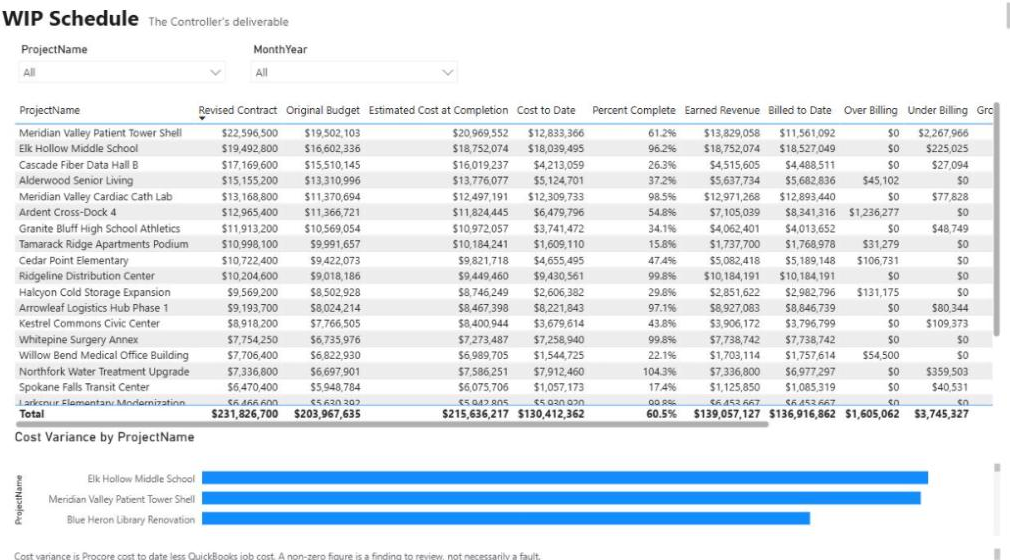
Cash and WIP answer different questions from overlapping data. The WIP schedule tells you whether you have billed ahead of or behind progress; persistent under billing is cash you have earned but not invoiced, which will never show up in a committed cash forecast until you bill it. That is why it helps to have WIP in place before cash. See our construction WIP reporting guide for the formulas, and the automated WIP schedule use case for how the two connect.
This work sits under our forecasting and insights and reporting and analytics capabilities. The specific pattern described here is the construction cash flow forecast use case, and the source joins are covered in Procore and QuickBooks integration.
Where to go next
- See the built version: watch the Procore, QuickBooks and HubSpot walkthrough, or read the connected financial reporting work example (production implementation, sample data shown).
- Start with WIP: download the WIP template to agree definitions before anything is automated.
- Scope your own: the WIP and cash reporting offer covers WIP, receivables and cash scenarios with explicit assumptions, at a fixed scope and price, agreed after discovery. Or plan your build and tell us what your cash meeting needs.
Frequently asked questions
What is the difference between committed and projected cash?
Committed cash has a document behind it: an issued invoice or an entered bill with an amount and a due date. Projected cash is expected but not yet documented, such as the next pay application or remaining contract value. Keep them as separate layers so the forecast can be audited.
Should unbilled backlog be in a construction cash forecast?
Not in the base forecast. Unbilled work has no invoice date or amount, so including it mixes estimates with commitments. Show projected billings as a separate, labeled scenario with its assumptions stated.
How should retainage be handled in a cash flow forecast?
Show retainage receivable and payable separately from current balances and only forecast a release once it is billed or scheduled. How it is modeled depends on how your accounting system records retainage, so confirm that before building the logic.
Where should cash forecast data come from, Procore or accounting?
Accounting is the better source for committed cash because it records what was actually invoiced and paid. Procore pay applications, budgets and contracts are useful for projected billings and as a cross-check, joined to accounting through a project crosswalk.
How far ahead should a weekly cash forecast go?
Our built version runs from four weeks back to 26 weeks ahead. The horizon is a setting, but the further out it goes, the more of the figure depends on items not yet invoiced, which is why longer-range views belong in scenarios.
Next step
Trying to automate a report like this?
Discuss your current reporting process: what the team does today, which systems are involved, and what you want to change.
Prefer email? charley@buildflows.ai
Get the next guide in your inbox
Field Notes: practical guides and new walkthroughs, about once a month.
Field Notes
Practical guides and new walkthroughs on construction data and automation, roughly monthly.
Keep learning
Reporting & analytics · October 7, 2026
Procore, QuickBooks & HubSpot Reporting Example
A 10-page Financial Operating System in Power BI that gives owners and controllers one view of contracts, WIP, cost, cash, pipeline, and labor—joined across Procore, QuickBooks Online, and HubSpot.
Reporting & analytics · October 8, 2026
Construction WIP Reporting in Power BI: A Controller's Guide
A practical guide to construction WIP reporting in Power BI: the formulas, where the data comes from in Procore and accounting, the mistakes that make a WIP schedule look right while being wrong, and how to automate it.

Integrations · August 18, 2026
How We Joined Procore, QuickBooks and HubSpot in Microsoft Fabric
A build walkthrough of the pipeline that joins Procore projects, QuickBooks jobs and HubSpot deals in Microsoft Fabric, including the crosswalk that refuses to guess and the gate that stops wrong numbers.