Microsoft Fabric gives a contractor one place to land Procore, accounting and scheduling data, clean it, check it, and serve it to Power BI without exporting spreadsheets every month. The pattern that works is a medallion lakehouse: raw data in bronze, validated data in silver, a modeled source of truth in gold. A data-quality gate in front of a Direct Lake semantic model keeps anything that fails out of the report. Fabric fits contractors with several source systems and a Power BI footprint; for one system and one dashboard it is overkill.
This guide covers the architecture, the parts of Fabric that matter for construction data, a build checklist, and the mistakes we see most often. It is based on platforms we have built from Procore, Sage 100 Contractor, QuickBooks Online, HubSpot, Outbuild and SharePoint.
What Microsoft Fabric is, in contractor terms
Fabric is Microsoft's analytics platform. It puts data storage, data engineering, pipelines and Power BI in one workspace, billed as one capacity. For a contractor, four pieces do most of the work:
- Lakehouse. Storage for tables (Delta format, in OneLake) and raw files. You typically create one per layer, or one lakehouse with clearly separated schemas.
- Notebooks. Python or Spark code that calls APIs, cleans data and builds tables. This is where the Procore extract, the cost-code mapping and the quality checks live.
- Pipelines. The scheduler that runs notebooks in order: extract, then transform, then validate, then publish.
- Semantic model and Power BI report. The semantic model holds relationships and measures (WIP, billed to date, retainage, scorecards). The report is what people see.
Each lakehouse also comes with a SQL analytics endpoint, a read-only SQL view of its tables. That matters more than it sounds: a controller can query the exact rows behind any total without opening Power BI.
Microsoft's own documentation at learn.microsoft.com/fabric covers the product surface in depth. The rest of this guide is about how to apply it to construction data.
Why construction data needs a medallion lakehouse
Construction reporting pulls from systems that were never designed to agree with each other. Procore holds projects, budgets, commitments, pay applications, RFIs, submittals, observations and punch items. Accounting (Sage, QuickBooks, Viewpoint and others) holds AR, AP and job cost. The scheduler holds milestones. A meaningful share of what leadership wants, such as wins, risks, client satisfaction and QA/QC registers, lives in no system at all.
There is also no shared key. A Procore project, a Sage job, a QuickBooks customer and a HubSpot deal for the same building usually have different IDs and slightly different names. That is why a single "connect Power BI straight to the API" approach breaks down: there is nowhere to fix data, record what failed, or prove what the report is showing.
The medallion pattern gives each problem a home.
| Layer | What it holds | What it does | Construction example |
|---|---|---|---|
| Bronze | Raw API payloads and files, exactly as received, with load timestamps | Preserves source data so a logic fix is a re-run, not a re-extract | The full JSON response from Procore's budget endpoint; Sage AP invoice rows |
| Silver | Typed, trimmed, standardized rows | Validates every row; failures go to a rejects table with a reason | Dates normalized, cost codes parsed into division and code, bad rows logged instead of dropped |
| Gold | Dimensions, facts, crosswalks and bridges in a star schema | The source of truth the semantic model reads | dim_project that ties Procore, Sage and Outbuild IDs to one project key; budget-line and invoice facts |
| Semantic model | Relationships and measures | Business logic in one place | Billed % of contract, net retainage, scorecard coverage |
Key Fabric features for contractors
Notebooks for API extraction
A notebook is the natural place for API work. In our first monthly-report rebuild, one notebook authenticates against the Procore API and pulls every endpoint the report needs. In the Procore, QuickBooks and HubSpot build, the Procore extract notebook reads its endpoints from a YAML registry instead of hard-coding each request, and runs every call through a rate limiter. When Procore versions an endpoint, we change one line in a version-controlled file. Our Procore API integration guide goes deeper on authentication and rate limits.
Not every source is an API. Sage 100 Contractor runs on an on-premises SQL database, so in the Procore, Sage and Outbuild platform it is read through a data gateway with read-only access.
Direct Lake semantic models
Direct Lake is a storage mode where the semantic model reads Delta tables in OneLake directly, instead of importing a copy of the data on each scheduled refresh. Practically, it means the report sees new gold data as soon as the tables are updated, without a heavy import step, and large fact tables stay fast.
The tradeoffs are real and worth planning for. Direct Lake works best when gold tables are already shaped for reporting, because transformations belong in the notebooks, not in Power Query inside the model. Some modeling features behave differently than in Import mode, and capacity size sets limits on table size. Check Microsoft's current Direct Lake documentation for the guardrails on your SKU before you commit a design.
The SQL analytics endpoint
The gold lakehouse's SQL endpoint shows tables, views and functions under dbo. In the Procore, Sage and Outbuild walkthrough we query project and vendor tables directly to show that the rows there are exactly the rows feeding the report. That is how finance verifies a number: they query the table, export it if needed, and compare it with the source system.
Pipelines and orchestration
Pipelines run the sequence. In the Procore, QuickBooks and HubSpot build we use two: an ingestion pipeline that runs the extract notebooks, and a master pipeline that moves data bronze to silver to gold, runs the quality gate, and only then refreshes the semantic model.
Key Vault for credentials
Procore client secrets, QuickBooks OAuth tokens and Sage database credentials belong in Azure Key Vault, referenced by the notebooks, never pasted into code. Every source connection should be read-only.
The data-quality gate: the part most builds skip
A polished dashboard is still unreliable if incomplete or invalid data reaches the semantic model. The sequence we use is:
Extract → Validate → Transform → Validate → Publish
The gate is a set of automated expectations that run after gold is built and before the model refreshes. If a blocking rule fails, the pipeline stops and the report keeps showing the last good data. The report footer shows the last refresh time and pipeline status, so readers know how current the numbers are. A stale answer beats a wrong one.
The rule count grows with the platform. The first version of the monthly report rebuild ran 63 data-quality expectations. The Procore, QuickBooks and HubSpot build runs 53 checks. The current Procore, Sage and Outbuild platform runs about 200 rules nightly. Typical rules for construction data:
- Every project in Procore has a crosswalk entry to accounting, or appears on a worklist.
- Every cost code exists in the cost-code master.
- Milestone finish dates are not before start dates.
- Pay-application balances are read from the latest issued or approved period, not summed across periods.
- Every AR invoice matches a project, or its dollar amount is carried on the data-gap register.
Live data surfaces problems that sample data never will. On the Procore, Sage and Outbuild platform, vendor insurance pulled from Procore showed certificates as expired, because the current certificates appear to be tracked somewhere else. The report did its job: it made the gap visible so the team could decide where the source of truth should be. Our construction data-quality rules guide lists the rules we use and how to write them.
How to build a Fabric lakehouse for construction reporting
This is the order we follow. Each step produces something you can check before moving on.
- Inventory the current report. List every page, number and input cell in the existing workbook, and where each one comes from. The monthly report we rebuilt was an 11-tab Excel workbook with about 700 manually maintained input cells.
- Map each figure to a source. Mark each as Procore, accounting, scheduler, or "no system." The "no system" list becomes structured SharePoint lists. Do not let it become a CSV people edit by hand.
- Get credentials and access early. Procore custom app, accounting API or SQL gateway, scheduler API, Fabric workspace, Key Vault. Access is usually the slowest step.
- Land bronze first. Extract every endpoint you need as raw payloads with load timestamps. Keep them.
- Build silver with a rejects table. Type, trim and standardize. Every row that fails validation is written to rejects with a reason.
- Build the crosswalk. Map projects, vendors and cost codes across systems in version-controlled reference tables. The crosswalk section below covers the matching rules.
- Model gold as a star schema. Shared dimensions (project, date, cost code, vendor) and facts (budget lines, invoices, billings, milestones, quality records).
- Write the quality gate. Start with blocking rules for anything that would make a number wrong, then add warnings.
- Build the Direct Lake semantic model. Put measures here, in one place, with clear names.
- Build the report, including coverage and data-quality pages. Every page needs project and month filters and a refresh-status footer.
- Test against live data and reconcile. Compare totals with the source systems and the old workbook. Expect to find errors in the old workbook as well as in the new build.
- Schedule, monitor and hand over. Nightly pipeline, failure notifications, and a short guide for the people filling in SharePoint lists.
Crosswalks, coverage and the zero-revenue trap
A project missing from accounting does not throw an error. It shows $0 revenue and $0 billing, which looks exactly like a project with no activity. That is why we treat source coverage as a first-class report page: which projects exist in Procore, accounting and the scheduler, and what each is missing. Some gaps are expected, such as scheduler projects still in pursuit that do not exist in Procore yet. The page makes them visible either way.
The crosswalk itself should match in a fixed order and refuse to guess. In the QuickBooks build: the controller's manual mappings first, then exact project number, then a name match only when it is unambiguous. Whatever cannot be matched should land on a worklist, not disappear. On the Procore, Sage and Outbuild platform, that is an Unresolved Records page that names the record, the amount it carries, and the system to fix it in. Once it is fixed at the source, it drops off after the next nightly run.
Common mistakes
- Transforming in bronze. Once raw data is overwritten, every logic fix needs a full re-extract. Keep bronze raw.
- Dropping rows silently. A filtered-out invoice is invisible money. Flag it, never drop it.
- Showing zero for missing data. A scorecard category with no data should be blank, not zero. In our scorecard, coverage % shows how much of the score is measured. On one platform it sat at 71% because the remaining 29% depends on manual SharePoint inputs that had not been filled in yet.
- Publishing without a gate. If a failed extract can reach the report, it eventually will, and someone will make a decision on it.
- Copying the old spreadsheet's logic blindly. Rebuilding the monthly report, we found two scoring errors in the original workbook that happened to offset each other on the sample project. About 42% of the scorecard weighting was disconnected from actual performance.
- Business logic in visuals. Measures belong in the semantic model, reference data belongs in tables, and both belong in version control.
- Using CSV for manual inputs. A CSV has no validation. A SharePoint list can validate fields, track who entered what, and let several people enter data per project and period.
Cost and operations considerations
Fabric is billed by capacity: you buy compute (an F SKU) that every workload in the workspace shares, plus OneLake storage. A few practical points:
- Size for the nightly window, not peak curiosity. Construction pipelines usually run once or a few times a day. Batch extracts and Spark notebooks are the heaviest load.
- Account for Power BI viewers. Licensing for report consumers depends on capacity size. Check Microsoft's current licensing guidance on learn.microsoft.com before you plan rollout.
- Respect source API limits. Rate limiting belongs in the extract code, not in the hope that nightly volume stays small.
- Plan for token expiry. QuickBooks Online OAuth requires periodic re-authentication. Put it on someone's calendar, or build monitoring that alerts before it lapses.
- Treat it as code. Notebooks, SQL, semantic models, report definitions and quality rules should deploy from a repository by script, so every change is reviewable and reversible.
When Fabric is (and is not) the right choice
| Situation | Fabric fit |
|---|---|
| Three or more source systems (PM, accounting, scheduler, CRM) feeding executive or lender reporting | Strong |
| Already on Microsoft 365 and Power BI, with SharePoint for manual inputs | Strong |
| Need for an audit trail, reconciliation and a SQL layer finance can query | Strong |
| Plans for AI agents that query governed data | Strong, because the gold layer is a clean target |
| One source system and a few dashboards | Weak: a direct Power BI connection may be enough |
| No one internal or external to own pipelines after go-live | Weak until ownership is solved |
| Organization standardized on a different cloud data warehouse | Use what you have; the medallion pattern carries over |
Fabric is not the only way to build this. We have also built Procore and P6 analytics on Azure with Cosmos DB (write-up). The architecture choices (raw retention, validation, crosswalks, a gate) matter more than the brand of the platform.
How we approach it
We have built this pattern on production systems and in sandboxes:
- Procore, Sage 100 Contractor, Outbuild and SharePoint. Two Power BI reports, 22 pages, about 180 measures and about 200 nightly quality rules, replacing a monthly progress workbook and a QA/QC workbook. See the full report showcase, the engineering write-up, and the video walkthrough.
- The first monthly-report rebuild. Procore to Fabric to Power BI end to end: an 11-tab workbook replaced by 12 Power BI pages and 99 measures read through Direct Lake, plus the scorecard errors found in the original workbook. See the rebuild article and the demo.
- Procore, QuickBooks Online and HubSpot. One lakehouse, extract notebooks per source, an 11-page report with WIP, backlog, AR, cash forecast and capacity, and a controller crosswalk, built and tested on sandbox data. See the build write-up and the demo.
On the Procore, Sage and Outbuild platform, we built with Claude connected to Fabric, Azure and Power Automate through MCP servers, which create notebooks, upload files, and run and validate items in the workspace. Then we tested every report page in the browser with Claude in Chrome before the client saw it. The principles behind all of it are on our approach page.
Where to go next
- Watch the Procore + Sage + Outbuild Fabric walkthrough to see every layer, from notebooks to the SQL endpoint.
- Read the playbook for replacing the monthly Excel report if you are planning the project.
- Browse more reporting guides and builds.
- If you want this built on your own Procore and accounting data, tell us what you are working with.
Frequently asked questions
Is Microsoft Fabric worth it for a construction company?
It is worth it when you report across several systems, such as Procore, accounting, a scheduler and a CRM, and people make financial decisions from the result. If you have one system and a few dashboards, a direct Power BI connection is usually enough.
What is a medallion architecture in Microsoft Fabric?
It is a layered lakehouse design. Bronze stores raw data exactly as received, silver types and validates it, and gold holds the modeled tables that reports read. Keeping raw data means a logic fix is a re-run rather than a full re-extract from the source APIs.
Can Microsoft Fabric connect to Procore?
Yes. Fabric notebooks can call the Procore REST API using a Procore custom app's credentials stored in Azure Key Vault. In one of our builds, the extract notebook reads its endpoints from a registry, rate-limits its calls, and lands the raw responses in a bronze lakehouse.
What is Direct Lake and should I use it instead of Import?
Direct Lake lets a Power BI semantic model read Delta tables in OneLake directly instead of importing a copy on each refresh. It suits a well-shaped gold layer, but it has modeling limits and capacity guardrails, so check Microsoft's current documentation for your SKU.
How do you stop bad data from reaching Power BI in Fabric?
Run a data-quality gate after gold is built and before the semantic model refreshes. Blocking rules, such as invalid keys or impossible dates, stop the pipeline so the report keeps the last good data and shows its refresh status.
Can Fabric read Sage 100 Contractor or QuickBooks data?
Yes. Sage 100 Contractor runs on an on-premises SQL database, which Fabric can read through a data gateway with read-only access. QuickBooks Online is read through its API using OAuth, which needs periodic re-authentication.
Next step
Have a problem like this?
Tell us the outcome you need. We'll tell you honestly how we'd approach it, and reply within two business days.
Keep learning
Reporting & analytics · October 7, 2026
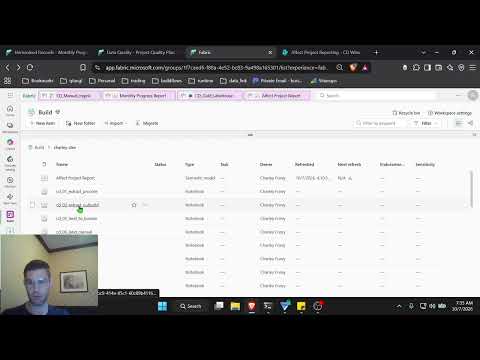
How We Built Construction Reporting in Microsoft Fabric
The engineering behind a nightly Procore + Sage + Outbuild reporting platform in Microsoft Fabric: medallion lakehouse, cost-code mapping, a quality gate, and building it with Claude and MCP servers.
Reporting & analytics · October 8, 2026
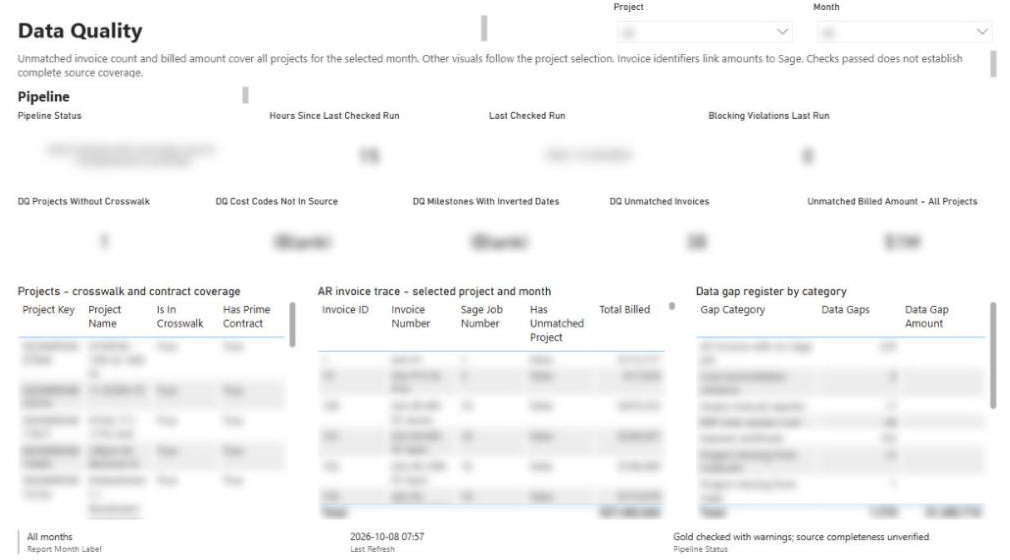
Construction Data Quality: The Rules That Make Reports Trustworthy
A practical checklist of the data-quality rules behind construction reports people can defend, from quality gates and blank-never-zero to cost-code crosswalks, reconciliation and snapshots.

Integrations · August 18, 2026
How We Joined Procore, QuickBooks and HubSpot in Microsoft Fabric
A build walkthrough of the pipeline that joins Procore projects, QuickBooks jobs and HubSpot deals in Microsoft Fabric, including the crosswalk that refuses to guess and the gate that stops wrong numbers.