Short answer: Over billing and under billing compare what you have billed on a job with what you have earned. Earned revenue is the revised contract multiplied by percent complete, and most contractors measure percent complete as cost to date ÷ estimated cost at completion (EAC). If billed to date is higher than earned revenue, the job is over billed, and the difference is a liability on the balance sheet. If earned revenue is higher than billed, the job is under billed, and the difference is an asset. Both are normal in small amounts. Large or growing amounts usually point to a stale cost forecast, unapproved change order work, or billing that is running ahead of the field.
This guide is for controllers, CFOs, project managers and anyone who has to read a WIP schedule and explain it. It works through three hypothetical jobs, shows the month-end journal entries, lists the usual causes, and ends with a review routine you can run every close. If you want to follow along with your own numbers, open the WIP and over/under billing calculator in another tab.
The four numbers behind every over/under figure
Every over/under billing figure comes from four inputs per job:
| Input | What it is | Where it usually comes from |
|---|---|---|
| Revised contract | Original contract plus owner-approved change orders | PM system (prime contract and change orders) or ERP contract module |
| EAC | Cost to date plus estimated cost to complete | The project manager's forecast |
| Cost to date | Job cost posted through the period end | ERP job cost, or PM system direct costs |
| Billed to date | Everything invoiced to the owner, gross of retainage held | Pay applications or ERP AR |
From those four you calculate:
- Percent complete = cost to date ÷ EAC, capped at 100%.
- Earned revenue = revised contract × percent complete.
- Over billing = billed to date − earned revenue, when positive.
- Under billing = earned revenue − billed to date, when positive.
Two definitions trip people up. First, pending change orders are not contract. Track them as exposure until the owner approves them. Second, most WIP schedules use gross billings, before retainage is deducted, because retainage is still billed revenue that has not been collected yet. Whichever convention you use, use it on every job and every month. Our metric dictionary writes these definitions down, including what happens when an input is blank.
Worked example 1: an over-billed job
Job A is a hypothetical job with easy numbers:
- Original contract $940,000, approved change orders $60,000, so the revised contract is $1,000,000.
- EAC is $850,000 and cost to date is $425,000, so percent complete is 425,000 ÷ 850,000 = 50%.
- Earned revenue is $1,000,000 × 50% = $500,000.
- Billed to date is $560,000.
- Billed minus earned is $560,000 − $500,000 = $60,000 over billed.
The job has collected, or at least invoiced, $60,000 for work it has not yet done by the cost measure. That is not automatically a problem. A schedule of values that front-loads mobilization, general conditions or stored materials will often produce this pattern early in a job. The question is whether the over billing shrinks as the work catches up, or keeps growing.
You can load this exact job into the calculator with Job A pre-filled and change one input at a time to see how sensitive the result is.
Worked example 2: an under-billed job
Job B, also hypothetical:
- Revised contract $2,400,000, EAC $2,000,000, cost to date $1,200,000.
- Percent complete is 1,200,000 ÷ 2,000,000 = 60%.
- Earned revenue is $2,400,000 × 60% = $1,440,000.
- Billed to date is $1,290,000.
- Earned minus billed is $1,440,000 − $1,290,000 = $150,000 under billed.
The job has done $150,000 more work than it has billed. Sometimes that is timing: costs posted on the 30th, pay application submitted on the 25th. More often it is worth a question. The most common answers are change order work done before the owner approved it, a pay application that was cut short, or costs that belong to another job.
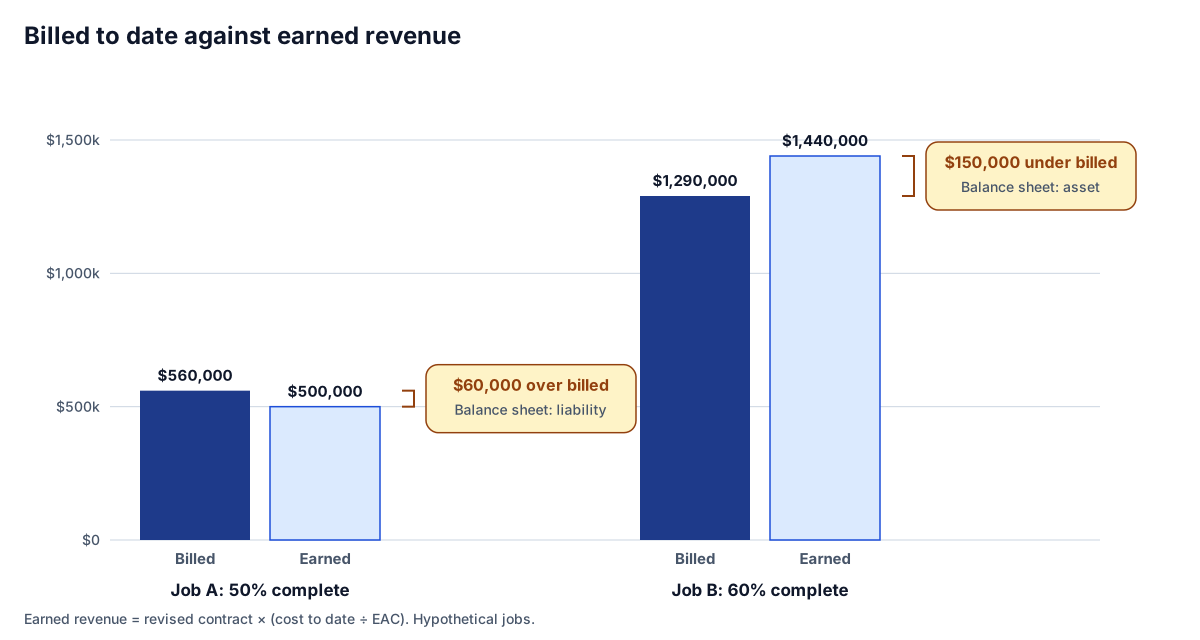 Over billing is billed above earned; under billing is earned above billed.
Worked example 3: when the forecast is stale
Job C shows why the cost forecast matters more than the billing.
- Revised contract $600,000, EAC $540,000, cost to date $567,000, billed to date $585,000.
- Cost to date has passed EAC, so raw percent complete is 105%. Capped at 100%, earned revenue is the full $600,000.
- The job appears $15,000 under billed.
That figure is meaningless. A job cannot be 100% complete by cost while the crew is still on site. The real problem is that the EAC was never updated. When the project manager re-forecasts the job at an EAC of $620,000:
- Percent complete becomes 567,000 ÷ 620,000 = 91.5%.
- Earned revenue becomes $600,000 × 91.5% ≈ $548,710.
- The job is now about $36,290 over billed, not under billed.
- Gross profit at completion is $600,000 − $620,000 = −$20,000, a projected loss.
Under percentage-of-completion accounting, a projected loss on a contract is generally recognized in full in the period it becomes known, not spread across the remaining work. Confirm the treatment with your CPA. The practical lesson is that any job where cost to date exceeds EAC should be on an exceptions list, not quietly capped.
What it looks like across the WIP schedule
Put the three jobs on one schedule, with Job C on its updated forecast:
| Job | Revised contract | % complete | Earned | Billed | Over billed | Under billed |
|---|---|---|---|---|---|---|
| A | $1,000,000 | 50.0% | $500,000 | $560,000 | $60,000 | |
| B | $2,400,000 | 60.0% | $1,440,000 | $1,290,000 | $150,000 | |
| C | $600,000 | 91.5% | $548,710 | $585,000 | $36,290 | |
| Total | $4,000,000 | $2,488,710 | $2,435,000 | $96,290 | $150,000 |
The net position is $53,710 under billed. Report the net, but never report only the net. A large over billing on one job can hide a large under billing on another, and lenders and sureties read the gross columns as well as the total. Calculate every figure job by job and then sum; never apply a portfolio percent complete to the portfolio contract value.
The journal entries and balance sheet impact
Over and under billing exist because billing and revenue recognition run on different clocks. During the month, invoices to the owner are usually posted to contract revenue (or a billings account) and job costs to cost of revenue. At month end, a WIP adjustment moves revenue from what was billed to what was earned.
For the jobs above, the month-end entries would look like this:
| Job | Debit | Credit | Amount |
|---|---|---|---|
| A | Contract revenue | Billings in excess of costs and estimated earnings (liability) | $60,000 |
| B | Costs and estimated earnings in excess of billings (asset) | Contract revenue | $150,000 |
| C | Contract revenue | Billings in excess of costs and estimated earnings (liability) | $36,290 |
| C | Provision for anticipated loss (expense) | Accrued loss on contract (liability) | Remaining loss, per your CPA |
After the entries, each job's revenue on the income statement equals its earned revenue. On the balance sheet, over billings sit in current liabilities and under billings sit in current assets. Under ASC 606 the same balances are often presented as contract liabilities and contract assets, and retainage receivable may be shown separately. Your auditors will have a view on presentation; the math underneath does not change.
There are two common ways to keep the adjustment accounts right month to month:
- Reverse and rebook. Reverse last month's WIP entry on the first day of the new month, then book the full new over/under balance at month end. Easy to audit, and the default in many ERPs.
- Book the change. Post only the difference between last month's balance and this month's. Fewer entries, but a missed month carries forward silently.
Either works if the balance on the balance sheet ties to the WIP schedule's gross over and under columns at every month end. That tie-out is the single most useful check in the whole process.
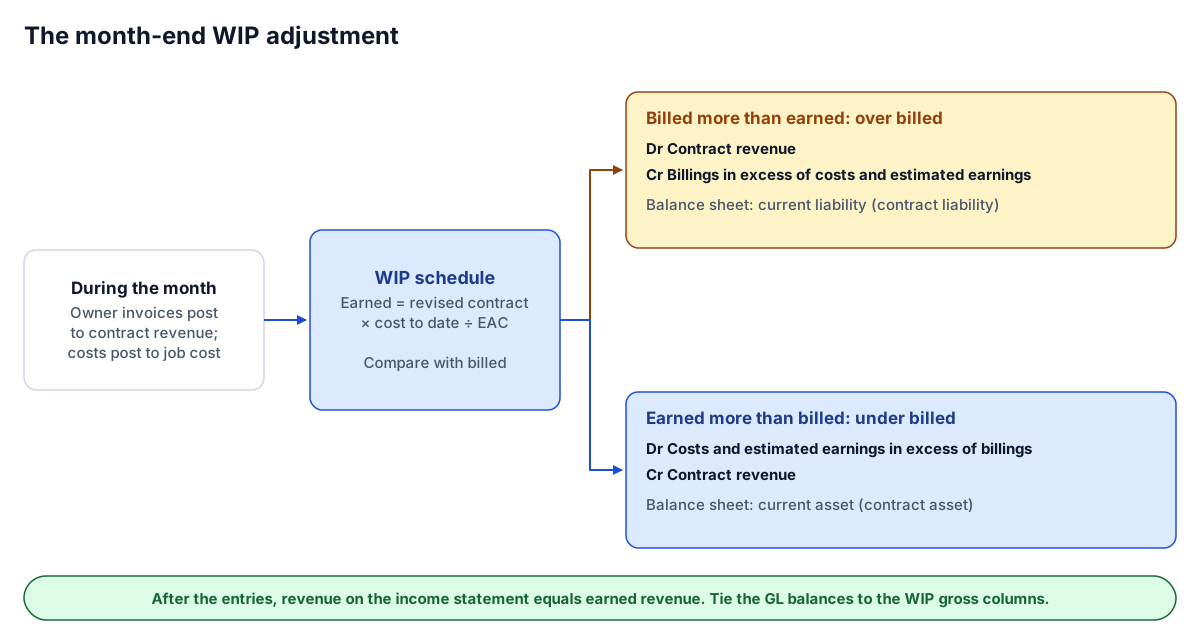 The WIP adjustment moves revenue from billed to earned and parks the difference on the balance sheet.
Common causes of over and under billing
| Pattern | Common causes | First question to ask |
|---|---|---|
| Over billed early in the job | Front-loaded schedule of values, mobilization and general conditions billed up front, stored materials billed before install | Is it shrinking each month as cost catches up? |
| Over billed and growing | Billing ahead of progress, EAC set too high so percent complete is understated | When was the EAC last reviewed, and by whom? |
| Under billed | Change order work done before approval, pay application cut short or missed, cost posted to the wrong job | Which change orders on this job are pending? |
| Under billed and growing | EAC set too low, so percent complete and earned revenue are inflated; a fade waiting to be recognized | Does cost to complete cover the commitments still open? |
| Swings month to month | Billing and cost cutoffs on different dates, large invoices posting late | Are cost and billing cut off on the same date? |
| Cost to date above EAC | Forecast not updated | Who owns the re-forecast, and by when? |
The pattern that deserves the most attention is persistent under billing on a job whose margin looks healthy. An understated EAC pushes percent complete up, which pushes earned revenue up, which makes the job look under billed and profitable at the same time. When the forecast is finally corrected, the margin drops all at once. That drop is the fade that sureties look for.
A month-end review routine
Run this every close. It takes the most time the first month and gets faster once the exceptions are under control.
- Freeze the inputs. Cut off cost and billing on the same date. Record which pay applications and which cost batches are in.
- Check coverage. Every open job should appear on the WIP schedule with contract, EAC, cost and billing. A missing job looks exactly like a job with no activity. See construction data quality rules for the checks we automate.
- Flag jobs with no forecast. A blank EAC is not a zero cost to complete. Label these jobs "No forecast" and leave them out of earned revenue until a forecast exists, rather than inventing a number.
- List jobs where cost to date exceeds EAC. Each one needs a re-forecast before the schedule is final.
- Review the gross columns. Sort by over billing, then by under billing. Ask the first question from the table above for the top five in each.
- Compare with last month. For each job, look at the change in over/under and in gross profit percentage. A drop of more than a couple of points in GP % at completion is a fade worth explaining. Our calculator flags fades above 2 points and under billing above $100,000 by default; set thresholds that fit your job sizes.
- Tie out the balance sheet. The over billings liability and under billings asset in the general ledger should equal the WIP schedule's gross columns.
- Snapshot the month. Save the final schedule as reported. Next month's fade and gain are measured against it, and the board pack should never change after it is sent.
If your schedule is still a spreadsheet, the WIP schedule template gives you the cost-to-cost formulas, the over/under columns, gross profit and backlog in Excel, with matching Power BI DAX measures for when you are ready to automate it.
When to automate the WIP schedule
The math here is simple. What makes a WIP schedule slow and fragile is everything around it: exporting from two systems, matching projects that do not share an ID, chasing blank forecasts, and rebuilding history when someone changes an EAC. Our guide to construction WIP reporting in Power BI covers how we automate it: a project crosswalk, a data quality gate before every refresh, and month-end snapshots so reported figures never move.
Where to go next
- Try it on your numbers: the WIP and over/under billing calculator handles one job or a pasted schedule.
- Start from a template: the WIP schedule template, with formulas and Power BI measures.
- Go deeper on automation: construction WIP reporting in Power BI.
- Spending days on the WIP every month? Tell us what systems you run and we will show you what an automated schedule would look like on them.
Frequently asked questions
What is the difference between over billing and under billing?
Over billing means you have billed more than you have earned based on percent complete, and it is reported as a liability. Under billing means you have earned more than you have billed, and it is reported as an asset. Both come from comparing billed to date with earned revenue, job by job.
How do you calculate over and under billing?
Calculate percent complete as cost to date divided by estimated cost at completion, multiply it by the revised contract to get earned revenue, then subtract earned revenue from billed to date. A positive result is over billing and a negative result is under billing. Do it for each job and then sum the results.
What is the journal entry for over billing?
At month end, debit contract revenue and credit billings in excess of costs and estimated earnings, a current liability, for the amount billed above earned. For under billing, debit costs and estimated earnings in excess of billings, a current asset, and credit contract revenue. Many contractors reverse the entry each month and rebook the new balance; confirm presentation with your CPA.
Is under billing bad?
Not always. Small amounts often come from timing, such as costs posted after the pay application cutoff. Large or growing under billing is a warning sign, commonly caused by unapproved change order work, missed billings or an estimated cost at completion that is set too low.
Should billed to date include retainage?
Most WIP schedules use gross billings, before retainage is deducted, because retainage is billed revenue that has not yet been collected. Whichever convention you choose, apply it to every job and every month so the schedule stays comparable.
Next step
Trying to automate a report like this?
Discuss your current reporting process: what the team does today, which systems are involved, and what you want to change.
Prefer email? charley@buildflows.ai
Keep learning
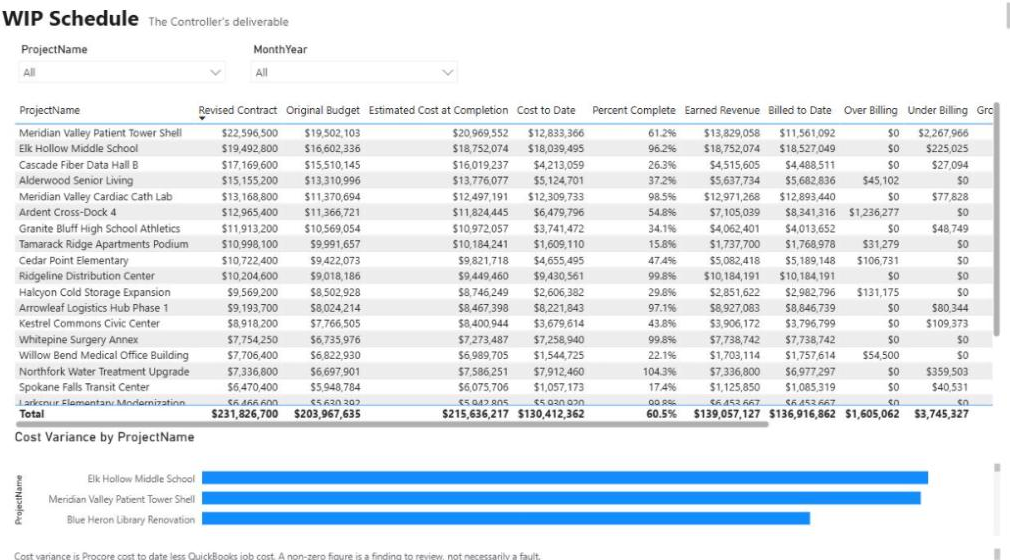
Reporting & analytics · October 8, 2026
Construction WIP Reporting in Power BI: A Controller's Guide
A practical guide to construction WIP reporting in Power BI: the formulas, where the data comes from in Procore and accounting, the mistakes that make a WIP schedule look right while being wrong, and how to automate it.
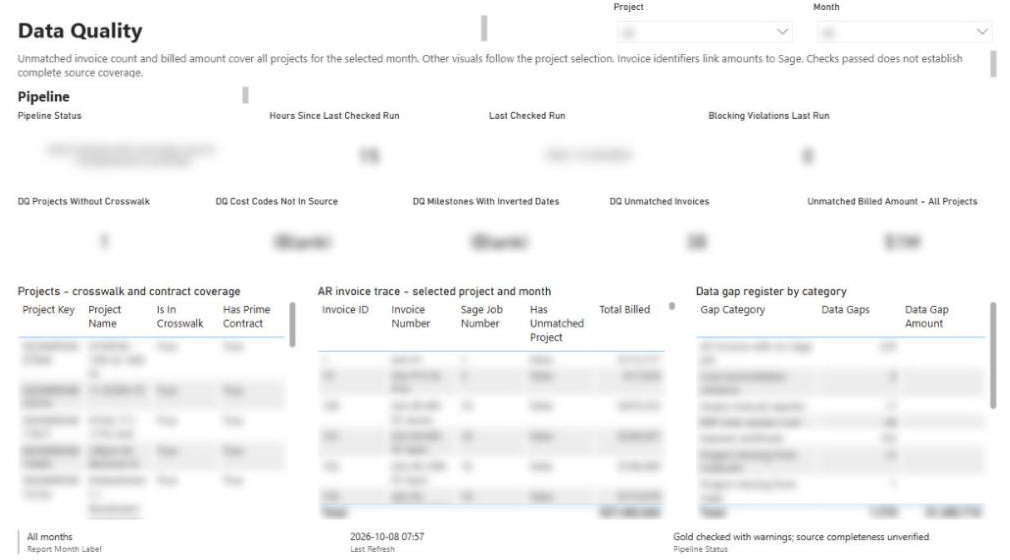
Reporting & analytics · October 8, 2026
Construction Data Quality: The Rules That Make Reports Trustworthy
A practical checklist of the data-quality rules behind construction reports people can defend, from quality gates and blank-never-zero to cost-code crosswalks, reconciliation and snapshots.
Reporting & analytics · October 9, 2026
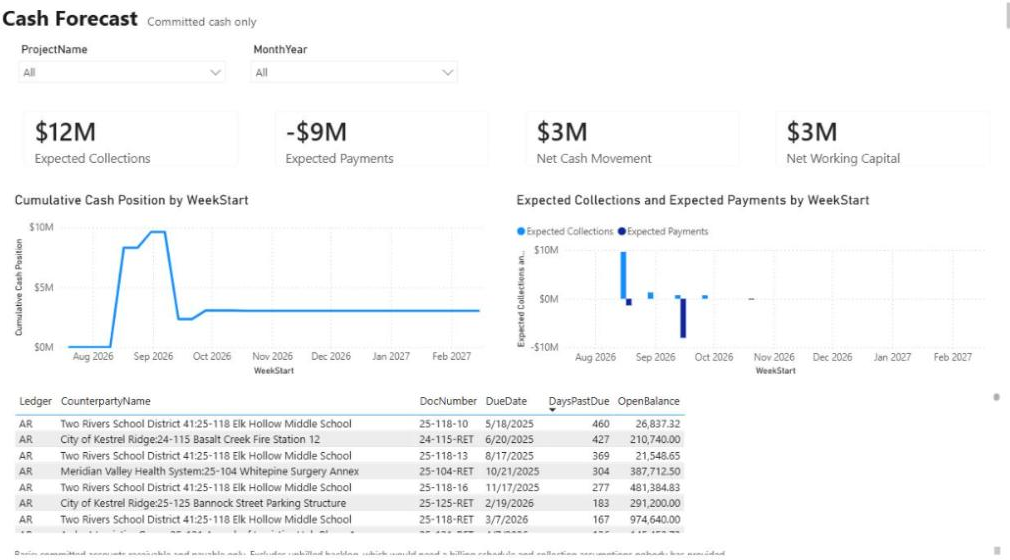
Construction Cash Flow Forecasting in Power BI: A Practical Guide
A practical guide to forecasting contractor cash in Power BI: start from committed AR and AP placed by due date, keep retainage separate, and layer scenarios with their assumptions written on the page.