Early warning indicators are the leading metrics that move before margin does. Watch seven of them on every job: forecast variance, fade/gain, overdue milestones, aging change orders, AR aging, observation closure time, and growing under-billing. Each one shows up weeks or months before the profit hits the books. Report them on one page, give each a threshold that leadership has agreed, and send each breach to a named owner. That turns month-end surprises into decisions made mid-month.
This guide covers what each indicator measures, why it leads margin fade, how to set thresholds as business decisions rather than technical defaults, and how to surface them so someone acts on them.
Why lagging metrics miss margin fade
Most contractor reporting is built around lagging metrics: gross profit to date, cost to date, revenue recognized, the closed month. They are accurate, but by the time they move the cause is already history. A job that faded three points was usually showing signs well before: a forecast that kept slipping, a change order nobody approved, billing that fell behind cost, an owner who stopped paying on time.
Leading indicators measure those causes directly. They are noisier and less precise than the closed books, but they arrive in time to act on. The aim is not to predict the future. It is to pull the conversation about a troubled job forward by a month or two, while there is still something to do about it.
A useful test for any metric: if this number got worse today, would anyone do anything different this week? If the answer is no, it is a report, not an early warning.
The seven leading indicators that flag trouble early
1. Forecast variance (EAC drift)
What it measures: the change in the estimate at completion (EAC) from one period to the next, by project and by cost code. It shows the change in cost at completion, not the variance to budget, which is a separate number.
Why it leads: EAC changes when a project manager learns something: a buyout came in high, production is behind, a scope gap surfaced. A rising EAC on a few cost codes usually comes before the fade. Lump-sum jobs are especially exposed, because cost moves and revenue does not.
Watch for: EAC rising two periods in a row, cost codes projected over budget, and forecasts that have not been updated at all. A forecast that never changes is often a warning in itself.
2. Fade/gain
What it measures: the period-over-period change in projected gross profit percentage at completion. See fade/gain in the glossary.
Why it leads: fade is the outcome you are trying to avoid, but the trend in fade is a leading signal. One small fade can be noise. Fade three months running, or fade on a job that is only a third complete, says the original estimate or the plan to deliver it is wrong.
Watch for: consecutive periods of fade, fade concentrated in one project manager's or one estimator's jobs, and fade that shows up only after a long stretch with no forecast changes.
3. Overdue milestones
What it measures: the share of schedule milestones past their planned date without being complete, and the gap between forecast finish and baseline finish.
Why it leads: schedule slip turns into cost through extended general conditions, acceleration, overtime, and liquidated damages exposure. Schedule data often shows slip before cost data does, because the cost of a late finish lands at the end of the job.
Watch for: a rising percentage of overdue milestones, slipping forecast finish dates, and milestones on the critical path that keep moving.
4. Aging change orders
What it measures: the age of the oldest unapproved change order on each job, and the total value of pending change orders compared with the cost variance they are meant to cover.
Why it leads: a pending change order is cost you have often already spent and revenue you have not secured. The longer it sits, the weaker your position and the larger the gap between what the forecast assumes and what the contract supports. When pending change orders are carrying most of a job's projected profit, the margin depends on negotiations, not on the work.
Watch for: change orders unapproved past an agreed age, pending value growing faster than approved value, and forecasts that assume full recovery on disputed changes.
5. AR aging and days to payment
What it measures: receivables by aging bucket (current, 1–30, 31–60, 61–90, 90+ days) and the average days from invoice to payment, by project and by customer.
Why it leads: slow payment rarely makes a job lose money on paper, but it is often the first sign of a dispute, an owner with cash problems, or a pay application the owner is not accepting. It also squeezes cash on jobs where you are paying subcontractors and suppliers on time.
Watch for: balances moving into older buckets, average days to payment rising on a customer, and short-paid pay applications.
6. Observation and quality closure time
What it measures: the average days to close an observation, the count of observations past due, and the share of punch items open longer than an agreed age.
Why it leads: quality items that stay open become rework, closeout delays, and retainage you cannot release. Slow closure also says something about how the site is being run. A project whose observation register keeps growing is usually under pressure elsewhere too.
Watch for: rising average closure days, past-due observations clustered by trade, and punch lists that grow late in the job.
7. Under-billing growth
What it measures: the gap between revenue earned (on a cost-to-cost percent-complete basis) and what you have billed, tracked over time. See over/under billing.
Why it leads: some under-billing is normal timing. Under-billing that keeps growing usually means one of three things: cost is running ahead of the plan, billable work (often change orders) cannot be billed yet, or the estimate is wrong and percent complete is overstated. Each one usually shows up as fade later.
Watch for: under-billing growing for two or more periods, under-billing on jobs with large pending change orders, and under-billing that disappears only when the forecast is revised up.
Early warning indicators at a glance
The thresholds below are examples, written to show the shape of a rule. Your numbers depend on your contract types, customers and risk appetite. The next section covers how to choose them.
| Indicator | Measured by | Typical source | Example rule shape | First owner |
|---|---|---|---|---|
| Forecast variance | Change in EAC vs last period, by cost code | Project management or ERP job cost | EAC up two periods in a row, or cost codes projected over budget | Project manager |
| Fade/gain | Change in projected GP % at completion | Job cost and forecast | Fade in consecutive periods, or above an agreed points limit | Operations leader |
| Overdue milestones | % of milestones overdue; forecast finish vs baseline | Schedule (P6, scheduling tools) | Overdue share above an agreed band | Project manager / scheduler |
| Aging change orders | Age of oldest unapproved CO; pending value vs cost variance | Project management | Oldest unapproved CO older than an agreed number of days | Project manager |
| AR aging | Aging buckets; average days to payment | Accounting | Balances over an agreed age, or days to payment trending up | Controller |
| Observation closure | Average days to close; past-due count | Project management (quality) | Average closure days above an agreed band | Superintendent / quality |
| Under-billing growth | Change in under-billing vs last period | WIP schedule | Under-billing growing for two or more periods | Controller and PM |
Our construction reporting build uses several of these as scorecard categories, with bands stored as data so management can change them without a developer. For example, its bands score average days to close an observation as healthy under 6 days and poor at 11 or more, and the oldest unapproved change order as healthy at 45 days or less and poor over 60. Those are that client's choices, not a standard. They show what a written-down threshold looks like.
Thresholds are business decisions, not technical settings
The most common mistake is to treat thresholds as something the report builder picks. A developer chooses "90 days" because it looks reasonable, nobody challenges it, and six months later nobody remembers why it is 90. Thresholds encode risk appetite, so the people who own the risk should set them.
A practical way to do it:
- Start from history. Pull the last two or three years of closed jobs. Look at what the indicator did on the jobs that faded and on the jobs that held. Where they separate is your first candidate threshold.
- Separate by contract type. Lump-sum, GMP, cost-plus and unit-price jobs behave differently. A single threshold across all of them will be either too noisy or too quiet.
- Use bands, not a single line. Healthy, watch and act work better than pass and fail. Watch gives a project manager time to respond before a job turns red.
- Write them down as data. Store thresholds in a table the business owns, with an effective date and the name of whoever approved them. Then a change is a decision with a record, not a code change.
- Review them on a calendar. Quarterly is a sensible starting point. If an indicator fires constantly and nobody acts, raise the threshold or drop the indicator. If jobs fade without it firing, tighten it.
- Measure the misses. Keep a list of jobs that faded and check which indicators fired, and when. That is the only honest way to know whether your early warning system works.
Two rules from how we build reporting matter here. Blank, never zero: a job with no forecast update should show as blank or flagged, not as zero variance, or a missing forecast reads as a healthy one. Flag, never drop: a project that cannot be matched across systems should stay in the totals and appear on an exceptions list, not quietly disappear from the count.
How to surface early warnings so people act on them
An indicator nobody sees, or that everybody sees but nobody owns, does not warn anyone. Surfacing has three parts.
One exceptions page, not ten dashboards
Put every breach on a single page, ranked, with the project, the indicator, the value, the threshold and the owner. Our connected financial reporting build has an Exceptions page that lists projects at risk, projects over their estimate at completion, cost codes projected over, unmapped projects, and pending change orders against cost variance. Leaders start there instead of hunting through pages.
A project health scorecard is a useful companion. It rolls several indicators into a weighted score per project, shows the arithmetic for each category, and reports how much of the score is actually measured, so a project with missing data does not look healthy by default.
Route each breach to an owner
Every indicator needs a named first owner and a deadline to respond. A PM gets the forecast variance and change order alerts, the controller gets AR and under-billing, the superintendent gets observation closure. Tools such as Power Automate or n8n can send a weekly digest, or an alert when a band changes, to the right person with a link to the detail. See the RFI and submittal aging alerts pattern for how that routing works.
Send changes, not repeats. An alert that fires every day for the same job gets ignored. Alert when a job moves from healthy to watch, or from watch to act, and put the standing list in the weekly digest.
Keep the history
Early warnings depend on trends, and trends need history. Snapshot the forecast, the WIP schedule and the scorecard every period, so you can see that EAC rose three months running and not only that it is high today. That usually means a data platform underneath the report, such as a Microsoft Fabric lakehouse, rather than a live connection to the source systems that only knows the current state. Microsoft documents the building blocks in its Fabric documentation.
The data you need, and where it usually breaks
The seven indicators come from different systems, which is why most contractors do not have them in one place.
- Forecast, budget, commitments and change orders usually live in the project management system, such as Procore.
- Cost to date, billing, AR and payments live in accounting, such as Sage or QuickBooks Online.
- Milestones and forecast finish dates live in the schedule.
- Observations and punch live in the project management system's quality tools.
The hard part is not the charts. It is joining these systems on the same project and the same cost code. That needs a project crosswalk and a cost-code map that someone maintains, plus data quality rules that flag mismatches. Without them, the exceptions page fills with false alarms and people stop trusting it. Our reporting and analytics and forecasting and insights pages describe how we build that foundation.
Early warning readiness checklist
Use this to check whether your current reporting can warn you in time.
- We have agreed on which leading indicators matter, and we have no more than about ten of them.
- Each indicator has a written definition: formula, source system, and refresh frequency.
- Each indicator has healthy, watch and act bands, approved by the person who owns the risk.
- Thresholds are stored as data with an effective date, not hard-coded in a report.
- Thresholds differ by contract type where that matters.
- Forecasts are updated on a fixed cadence, and a missing update is flagged, not shown as zero.
- Projects and cost codes are matched across project management, accounting and schedule, with unmatched items flagged.
- Forecast, WIP and scorecard are snapshotted every period so trends are visible.
- There is one exceptions page that ranks every breach with its owner.
- Each indicator has a named first owner and an expected response time set by the business.
- Alerts fire on band changes, not every day for the same job.
- We review thresholds quarterly against the jobs that actually faded.
If you check fewer than half, start with the data foundation and one exceptions page before adding alerts. Our reporting readiness checklist covers the foundation in more detail.
Where to go next
- If WIP and forecasting are where your early warnings need to start, see the WIP and cash forecast offer, or plan your build to scope something broader.
- See the scorecard and exceptions pages working in the construction reporting walkthrough and the connected financial reporting work example.
- Download the WIP schedule template to start tracking under-billing and fade by period.
- If you want to talk through which indicators fit your jobs, start a conversation.
Frequently asked questions
What are early warning indicators in construction?
They are leading metrics that change before profit does, such as rising estimates at completion, consecutive fade, overdue milestones, aging unapproved change orders, slowing payments, slow quality closure and growing under-billing. They give leaders time to act before the closed month shows the loss.
What causes margin fade on construction projects?
Common causes include estimating gaps, buyout overruns, schedule slip that extends general conditions, unrecovered change orders, rework and productivity problems. Each usually shows up first in a leading indicator, such as EAC drift, aging change orders or under-billing growth.
Is under-billing a warning sign?
Some under-billing is normal timing between doing work and billing it. Under-billing that grows for several periods is a warning, because it often means cost is running ahead of plan, billable changes are stuck, or percent complete is overstated.
How do you set thresholds for construction KPIs?
Start from two or three years of closed jobs and look at where the indicator separated jobs that faded from jobs that held. Set healthy, watch and act bands, vary them by contract type where needed, have the risk owner approve them, and review them quarterly.
How should early warnings be reported?
Put every breach on one ranked exceptions page with the project, value, threshold and owner. Route each indicator to a named first owner and send alerts when a project changes band, with the standing list in a weekly digest.
What data do you need for early warning reporting?
Forecasts, budgets, commitments and change orders from project management, cost, billing and AR from accounting, milestones from the schedule, and quality registers. They must be matched on project and cost code, and snapshotted every period so trends are visible.
Next step
Trying to automate a report like this?
Discuss your current reporting process: what the team does today, which systems are involved, and what you want to change.
Prefer email? charley@buildflows.ai
Get the next guide in your inbox
Field Notes: practical guides and new walkthroughs, about once a month.
Field Notes
Practical guides and new walkthroughs on construction data and automation, roughly monthly.
Keep learning
Reporting & analytics · October 8, 2026
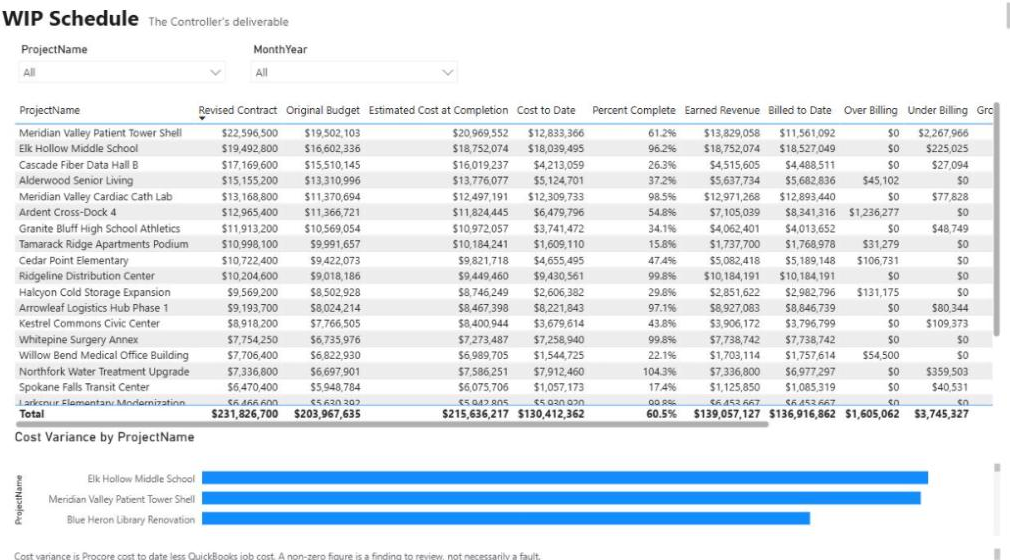
Construction WIP Reporting in Power BI: A Controller's Guide
A practical guide to construction WIP reporting in Power BI: the formulas, where the data comes from in Procore and accounting, the mistakes that make a WIP schedule look right while being wrong, and how to automate it.
Reporting & analytics · October 8, 2026
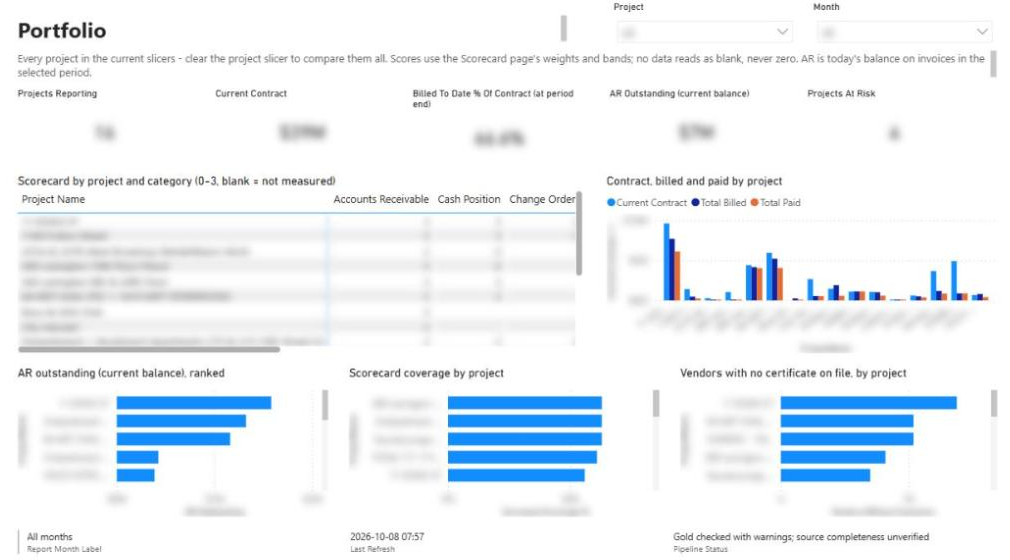
Construction Project Reporting: Solution Showcase
Two Power BI reports—22 pages and ~180 measures—that replaced a general contractor's hand-filled monthly progress and QA/QC workbooks. Computed nightly from Procore, Sage 100, Outbuild, and SharePoint, and published only after ~200 data-quality rules pass.
Reporting & analytics · October 7, 2026
Procore, QuickBooks & HubSpot Reporting Example
A 10-page Financial Operating System in Power BI that gives owners and controllers one view of contracts, WIP, cost, cash, pipeline, and labor—joined across Procore, QuickBooks Online, and HubSpot.