Video unavailable? Watch on YouTube or read the written breakdown.
The short version: If the questions you need answered live entirely inside Procore (budget, change orders, RFIs, submittals, observations, adoption), start with Procore Analytics. It gives you Procore's own data model and ready-made Power BI reports, and it's the fastest way to good Procore reporting. Build a custom Power BI or Microsoft Fabric model when the answer needs data Procore doesn't hold: actual cost and billing from your accounting system, schedule dates from P6 or Outbuild, pipeline from your CRM, or inputs your team keeps in spreadsheets. Most contractors end up using both: Procore Analytics as a clean Procore feed, and a custom model that joins it to everything else.
This is a practical comparison, not a sales pitch. Procore Analytics is a solid product, and for many questions it's the right answer. The useful question isn't which one is better. It's which questions you need answered, and where the data for each one lives.
What Procore Analytics is
Procore Analytics 2.0 is Procore's reporting product for company data. Per Procore's Analytics 2.0 documentation, it provides out-of-the-box Power BI reports, which you can use in your own Power BI environment or through the embedded Analytics app inside Procore. Procore lists report sets for risk, adoption, financials and budget, specialty contractors and resource management, among others.
A few things matter for planning:
- Delivery is through Delta Sharing. Procore calls the current delivery method the Cloud Connector, built on the open Delta Sharing protocol. You generate a token in Procore and connect Power BI Desktop using the server URL and bearer token. Procore's docs also describe copying the data into a Microsoft Fabric lakehouse, a Databricks workspace, and other storage targets.
- Permissions follow Procore. The documentation states that Analytics 2.0 follows the same permissions as Procore objects, and Procore documents row-level security for the Power BI reports.
- Tokens expire. Procore's guidance sets a maximum token lifetime. Someone has to own renewing it, or refresh stops.
- Power BI licensing still applies. Procore's FAQ notes that Power BI licenses are still required to share Power BI reports.
Check the Getting Started with Analytics 2.0 guide for current refresh frequency, report pages and setup steps. Those details change, and Procore's docs are the source of truth.
What a custom Power BI or Fabric reporting model is
A custom model is a reporting layer you own, built around your definitions rather than any one vendor's. In our builds it typically looks like this:
- Ingest each source on a schedule: Procore, the accounting system, the schedule, the CRM, and structured manual inputs such as SharePoint lists.
- Land and clean the data in layers, usually a medallion architecture in a Microsoft Fabric lakehouse (raw, cleaned, reporting-ready).
- Map projects, jobs and cost codes across systems with a crosswalk, because Procore project IDs and accounting job numbers rarely match.
- Check the data with quality rules before anything publishes.
- Model it as a semantic model in Power BI with shared dimensions (project, date, cost code, vendor) and measures that match finance's definitions.
Procore is one of several sources in that model, and Procore Analytics can be the way Procore data arrives. The two aren't mutually exclusive. More on that below.
Side-by-side comparison
| Procore Analytics | Custom Power BI / Fabric model | |
|---|---|---|
| Data scope | Procore data | Procore plus accounting, scheduling, CRM, payroll, spreadsheets |
| Time to first report | Fast: prebuilt reports and a documented connection | Longer: discovery, mapping and model build come first |
| Data model | Procore's model and table names | Your model, designed around your reporting questions |
| Definitions | Procore's report logic | Your agreed definitions (margin, percent complete, WIP) |
| Cross-system joins | Not the purpose; you add them yourself | The main purpose: crosswalks for projects, jobs and cost codes |
| Security | Follows Procore permissions; row-level security documented | You design it, usually from project assignments and roles |
| Ownership and upkeep | Procore maintains the data model and reports | You (or a partner) maintain pipelines, mappings and checks |
| Change control | Follows Procore's release schedule | Follows yours, versioned as code |
| Best for | Procore-native operational and adoption reporting | Financial, schedule and portfolio reporting across systems |
Neither column is free of work. Procore Analytics still needs someone to manage tokens, licenses and report customization. A custom model needs someone to own pipelines and mappings.
When Procore-only reporting is enough
Procore Analytics is usually enough when every number on the page comes from Procore. Good fits:
- Project management activity: open and overdue RFIs, submittal aging, observations, punch items, inspections.
- Budget views as Procore holds them: original budget, approved changes, revised budget, committed costs, pending change orders, provided your team keeps the Procore budget current.
- Adoption and usage: who is using which tools, and on which projects.
- Field and safety reporting: incidents, daily logs and observations by project.
If your accounting system syncs actual costs into Procore through a supported integration and your team trusts that sync, Procore-only reporting can stretch further into cost. Check what actually lands in Procore before you rely on it: which cost types, how often, and whether it's posted or just committed.
The test is simple. Take your current monthly report and mark each figure with the system it comes from. If nearly every figure is marked "Procore," start with Procore Analytics and customize from there.
When you need accounting and scheduling joined
The picture changes when the important numbers live outside Procore. These are the common triggers.
Financial reporting that finance signs off
A WIP schedule needs contract value and estimated cost from the project side and billed-to-date and actual cost from accounting. Over and under billing, AR aging, retainage and job cost reconciliation all depend on the accounting system's posted figures. If the controller's numbers come from Sage, Viewpoint, QuickBooks or another ERP, the report has to read from that system and match it.
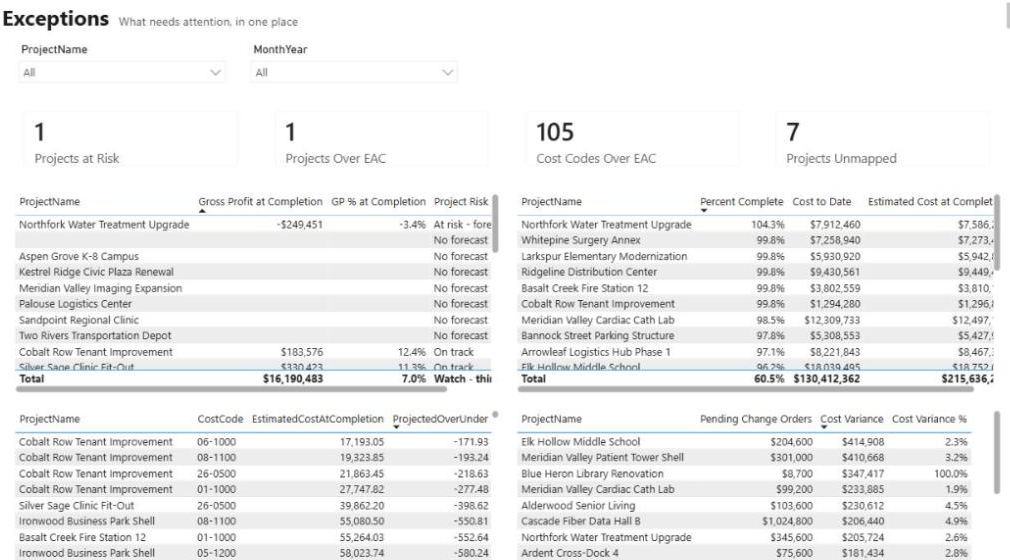
In our connected financial reporting build, Procore holds the job forecast, QuickBooks Online holds the money, and HubSpot holds the work not yet won. The three systems share no common ID, so a project crosswalk links them and unmatched projects stay visible on an exceptions page. That join is the core of the work, and no single vendor's report could do it.
Schedule data next to cost
Milestones, schedule variance and look-ahead dates usually live in Primavera P6, Outbuild, Microsoft Project or a scheduling tool, not in Procore. If the monthly report shows budget health next to overdue milestones, you need the schedule as a source. Our construction reporting build brings in Outbuild milestones alongside Procore and Sage 100 Contractor for exactly this reason.
Portfolio and forward-looking views
Backlog, burn, cash forecast and labor capacity combine contract data, pipeline, billing and staffing. A portfolio page that spans every job, with drill-down to project and line, needs one project dimension across systems.
Inputs nobody keeps in a system
Many monthly reports include figures a project manager types in: forecast to complete, risk notes, narrative commentary. Those belong in a structured input such as a SharePoint list with validation, not in a spreadsheet emailed the night before. A custom model can read them alongside system data. See structured manual inputs in SharePoint.
Using both: Procore Analytics as a source
You don't have to choose. If you already license Procore Analytics, its Delta Sharing feed can be a clean way to land Procore data in your own Fabric lakehouse, and Procore documents that path. The custom model then joins that data to accounting, schedule and CRM sources.
A few things to plan for if you do this:
- Table and column names are Procore's. Procore's FAQ notes that tables and columns were renamed between Analytics 1.0 and 2.0. Map them in your cleaned layer so a future rename breaks one mapping, not every report.
- Token renewal is an operational task. Put the expiry date somewhere a person will see it, and alert on refresh failures.
- Check coverage. Confirm the objects you need are in the share. If something isn't, the Procore REST API is the alternative. Our Procore API integration guide covers that route.
Whichever way Procore data arrives, the custom model's value is in what sits on top: the crosswalk, the quality checks and the shared definitions.
Data quality and definitions decide which numbers people trust
The most common reason a construction report stops being used isn't the tool. It's that two reports show two different numbers for the same thing, and nobody can say which is right. That happens in both approaches.
Agree definitions before building
Write down, in plain language, how each key figure is calculated and which system owns it:
- Percent complete: cost-to-cost from accounting, or a PM's estimate in Procore?
- Margin: on the original estimate, the revised budget, or the current forecast?
- Committed cost: approved commitments only, or pending ones too?
- Actual cost: posted in the ERP, or what has synced into Procore?
Procore Analytics gives you Procore's answers to these. They may match your finance team's or they may not. A custom model gives you your answers, but only if someone writes them down first. The metric dictionary is a starting point.
Make problems visible instead of hiding them
A few rules we use in every build:
- Blank, never zero. Missing data shows as blank or "unavailable," never as zero, which reads as a real number.
- Flag, never drop. A record that fails a check stays visible on an exceptions page with the reason. It doesn't silently vanish from totals.
- A stale answer beats a wrong one. If a load fails partway, the report keeps the last good numbers and says how old they are.
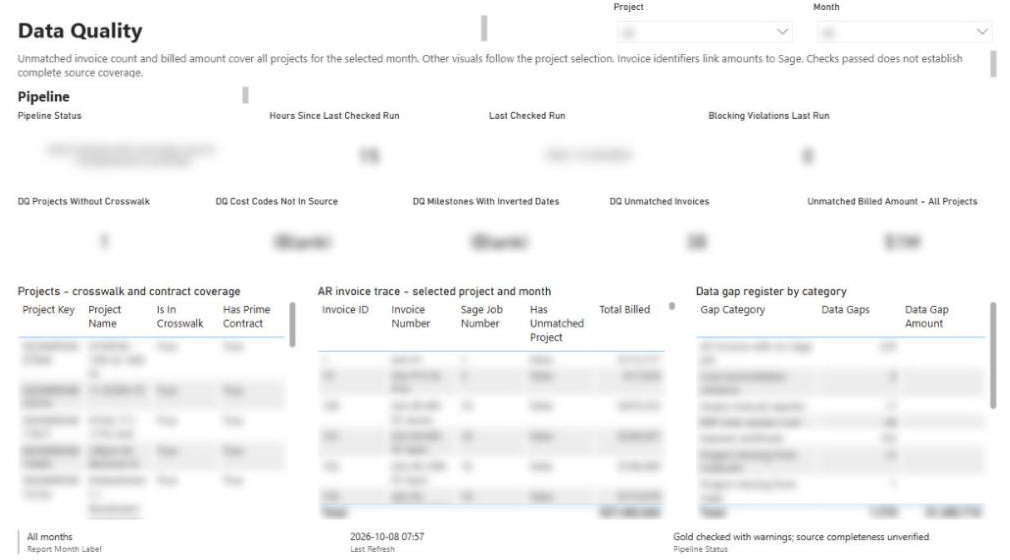
In our construction reporting build, publication happens only after about 200 automated data-quality checks pass, and every page footer shows the reporting month, last refresh time and pipeline status. Our data quality rules guide lists the checks we start with.
Fix it at the source
When a check fails because a Procore project has no job number, or a cost code doesn't exist in the ERP, the fix belongs in the source system or the crosswalk, not in a DAX measure. That keeps every report downstream correct, not just the one someone patched. Maintaining the cost code crosswalk as master data is part of this.
Decision checklist
Work through these with the people who use the report: the controller, a project executive and whoever owns Procore.
- List the 10 to 20 figures that matter most in your current monthly or weekly report.
- Mark the system each figure comes from: Procore, accounting, schedule, CRM, payroll or manual.
- If almost everything is Procore, start with Procore Analytics and its prebuilt reports.
- If accounting figures appear (actual cost, billed to date, AR, retainage), confirm whether they reach Procore through a sync you trust or need to come from the ERP directly.
- If schedule dates appear, identify the schedule system and whether it has an API or export you can read on a schedule.
- Check whether Procore projects and accounting jobs share an ID. If not, plan a crosswalk and an owner for it.
- Write the definition of percent complete, margin, committed cost and actual cost, and get finance to agree.
- Decide what the report should show when data is missing or late.
- Confirm Power BI licensing and who will view reports, inside and outside the company.
- Name an owner for refresh failures, token renewal and mapping exceptions.
- Decide who can see which projects, and whether that follows Procore permissions or your own roles.
If you finish this list with mostly Procore figures and agreed definitions, Procore Analytics will likely serve you well. If you finish it with three or more systems and a crosswalk to maintain, a custom model is the more durable path. Our reporting readiness checklist goes deeper on the second case.
What a custom build involves
If the checklist points to a custom model, this is the shape of the work. Details are in our reporting and analytics capability page and the Procore data in Power BI use case.
- Discovery. Map the report's figures to sources and definitions, and trace a few recent numbers back to each system.
- Connections. Read each source on a schedule. On-premises accounting databases usually need a data gateway.
- Lakehouse and mapping. Land raw data, clean it, and apply the project and cost code crosswalks. See a construction data lakehouse in Fabric.
- Quality gate. Run checks before publishing and route exceptions to the person who can fix them.
- Semantic model and pages. Build measures to the agreed definitions, then the pages, starting with the ones people use every month.
- Handover. Document definitions, mappings and runbooks so your team can operate it.
Scope and price are fixed and agreed after discovery. Measure time saved against a baseline: how many hours the current report takes to assemble each month, and how many after.
Where to go next
- Watch the Procore, QuickBooks and HubSpot reporting walkthrough to see a crosswalk and exceptions page in a working report, or read the connected financial reporting work example.
- Estimate what your current report costs to produce with the monthly report cost calculator.
- See the monthly report replacement offer, or plan your build if you already know which systems need to be joined. We're happy to talk it through on a fit call at /engage.
Frequently asked questions
Is Procore Analytics enough for construction financial reporting?
It can be if the figures you need are held in Procore and your team keeps the Procore budget current. Reports that finance signs off, such as a WIP schedule, over and under billing, AR and retainage, usually depend on posted figures in the accounting system. In that case the report needs to read from the ERP directly or from a sync you have verified.
Can I use Procore Analytics data in Microsoft Fabric?
Procore's documentation describes copying Analytics 2.0 data into a Fabric lakehouse using Delta Sharing. That makes Procore Analytics a reasonable way to land Procore data in your own model, where it can be joined to accounting and schedule sources. Check Procore's current docs for the exact steps and token requirements.
Do I still need Power BI licenses with Procore Analytics?
Procore's FAQ states that Power BI licenses are still required to share Power BI reports. Plan licensing around who will view reports, including people outside the company. Confirm current terms with Procore and Microsoft.
How do I join Procore projects to accounting jobs in Power BI?
Use a crosswalk table that maps each Procore project ID to its accounting job number, and keep it as maintained data rather than logic inside measures. Feed one shared project dimension from it. Projects that don't match should appear on an exceptions page so someone fixes the mapping at the source.
Why do Procore reports and accounting reports show different numbers?
Usually because they measure different things: committed versus posted cost, a PM's percent complete versus cost-to-cost, or data that hasn't synced yet. Write down the definition and owning system for each key figure and get finance to agree before building. Then show the definition and last refresh time on the report.
Next step
Trying to automate a report like this?
Discuss your current reporting process: what the team does today, which systems are involved, and what you want to change.
Prefer email? charley@buildflows.ai
Get the next guide in your inbox
Field Notes: practical guides and new walkthroughs, about once a month.
Field Notes
Practical guides and new walkthroughs on construction data and automation, roughly monthly.
Keep learning
Integrations · October 8, 2026
Procore API Integration Guide: Patterns, Crosswalks and Governance
A practical guide to connecting Procore with accounting, scheduling, BI and CRM systems: which pattern to use, how to link projects across systems, and how to keep the numbers trustworthy.

Integrations · August 18, 2026
How We Joined Procore, QuickBooks and HubSpot in Microsoft Fabric
A build walkthrough of the pipeline that joins Procore projects, QuickBooks jobs and HubSpot deals in Microsoft Fabric, including the crosswalk that refuses to guess and the gate that stops wrong numbers.
Reporting & analytics · October 8, 2026
Construction Data Quality: The Rules That Make Reports Trustworthy
A practical checklist of the data-quality rules behind construction reports people can defend, from quality gates and blank-never-zero to cost-code crosswalks, reconciliation and snapshots.