The short answer: Emit five structured, versioned events: mcp.call.started, mcp.call.completed and mcp.call.failed for every tool call, plus mcp.session.summary when a session ends and mcp.chain.summary when a run of tool calls inside one model response finishes. Every event carries a request ID, a session ID, a hashed user ID, the environment and trace IDs. Never put raw tool inputs, raw outputs, prompts, tokens or personal data in this stream; log hashes, sizes, schema identifiers and flags instead. Trace each model inference as a parent span, each tool call as a child, and each external API call nested under that. Then compute reliability, product, cost and quality metrics downstream, including two signals most teams miss: arguments the server had to auto-correct, and tool names the model made up.
It is based on the telemetry specification we drafted for MCP tool calls during our agent work at Trimble, rewritten as a vendor-neutral blueprint. It is a companion to our article on the Tool Runtime MCP gateway, which shows a working gateway and its per-call log. That article is about the product. This one is the field-level spec: what to emit, what to keep out, and what to compute from it.
Two records, two jobs
Teams often try to make one log do everything. It works better as two:
| Call log (debug and audit) | Telemetry stream (this blueprint) | |
|---|---|---|
| Purpose | Answer "why did the agent say that?" for one call | Run SLOs, product analytics, cost attribution and quality tuning across all calls |
| Contents | Input and output, where policy allows, plus who and through which key | Metadata, hashes, sizes, timings, flags. No raw payloads |
| Audience | A small group with access to the underlying data | Infra, platform, product and data teams, dashboards, alerting tools |
| Retention | Short, or per your audit requirements | Raw events for weeks; aggregates for years |
The Tool Runtime gateway captures input and output on purpose, because that is what makes a single bad answer debuggable. The telemetry stream goes to more people and more tools, so it has to be safe to share. Keep them separate, join them on request_id, and you get both.
Goals and non-goals
Write these down before you add a single field. Ours:
Goals
- Enforce reliability and SLOs for tool calls.
- Trace model and tool interactions end to end for debugging.
- Measure tool adoption and usage.
- Attribute cost by tool, session and tenant.
- Support audit and compliance reviews.
Non-goals
- Full payload logging of tool inputs and outputs.
- Logging raw personal data or secrets.
- Reconstructing whole conversations from telemetry alone.
The non-goals do as much work as the goals. They are what you point to when someone asks to "just add the prompt" to the event.
Event taxonomy
| Event | When it fires | Why it exists |
|---|---|---|
mcp.call.started | A tool call is initiated | Captures intent: which tool, from where, with what schema, before anything can fail |
mcp.call.completed | A tool call returns successfully | Latency breakdown, size, retries, tokens and estimated cost |
mcp.call.failed | A tool call fails terminally | Error category, retryability and timing |
mcp.session.summary | A session ends or times out from inactivity | One row per session for product and cost analysis |
mcp.chain.summary | A sequence of tool calls within one model response cycle completes | Shows how tools are combined, how deep chains go, and where they are abandoned |
Every started event should end in exactly one completed or failed event with the same request_id. A started event with no terminal event is itself a signal: a crash, a timeout the server never saw, or a client that disconnected.
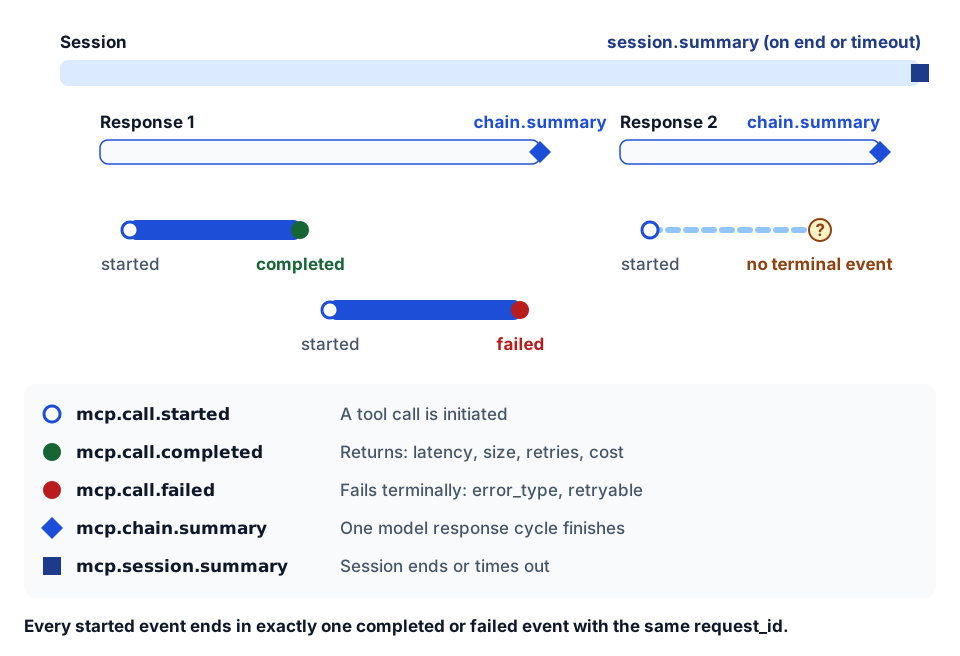 Where the five events fire in a session, and the orphaned start that should raise a flag.
All events must be structured JSON, versioned (event_version), forward compatible (consumers ignore fields they do not know) and aligned with OpenTelemetry where possible.
Common fields on every event
| Field | Required | Notes |
|---|---|---|
event_name | Yes | For example mcp.call.started |
event_version | Yes | For example 1.0. Bump on breaking changes only |
timestamp | Yes | ISO 8601, UTC |
request_id | Yes | Unique per tool invocation. The join key to the call log |
session_id | Yes | Unique per user session. Hash it if the raw value works as a credential |
user_id_hash | Yes | Keyed hash, never the raw ID (see privacy rules below) |
environment | Yes | prod, staging or dev |
tenant_id | Optional | The company or organization in a multi-tenant deployment |
app_id | Optional | Which integration or agent made the call |
trace_id, span_id | Optional | For OpenTelemetry correlation. Make them required as soon as tracing is live |
Call event fields
On mcp.call.started:
| Field | Required | Notes |
|---|---|---|
mcp_server_name | Yes | The logical server, not the hostname |
tool_name | Yes | The tool identifier as the model called it |
invocation_source | Yes | model, system or user |
tool_version | Optional | Schema version of the tool |
tool_schema_hash | Optional | Hash of the tool's input schema. Detects schema drift between what the model saw and what the server runs |
model_name, model_version | Optional | When a model initiated the call |
input_schema_valid | Optional | Result of pre-validation |
parallel_group_id | Optional | Shared by calls the model issued concurrently |
On mcp.call.completed:
| Field | Required | Notes |
|---|---|---|
latency_ms | Yes | Total call duration |
success | Yes | Always true on this event; keeps queries simple |
network_latency_ms, tool_execution_ms, model_reasoning_ms | Optional | The breakdown that tells you where time went |
output_size_bytes | Optional | Large outputs cost context and money |
retry_count, fallback_triggered | Optional | Hidden instability shows up here before it shows up as failures |
tokens_input, tokens_output, estimated_cost_usd | Optional | For cost attribution |
On mcp.call.failed:
| Field | Required | Notes |
|---|---|---|
error_type | Yes | One of validation, timeout, auth, rate_limit, internal |
retryable | Yes | Whether a retry could succeed |
error_code | Optional | Service-specific code, such as the stable codes in your error envelope |
error_message_hash | Optional | Hash, not the raw message, which can contain data |
latency_ms, retry_count | Optional |
Keep error_type to a small closed set. Five categories are enough to drive alerting. The detail belongs in error_code, which should match the stable error codes your server already returns (we describe that envelope in hardening MCP servers for production).
A completed event in practice looks like this:
{
  "event_name": "mcp.call.completed",
  "event_version": "1.0",
  "timestamp": "2026-10-10T14:03:22.418Z",
  "request_id": "req_7f3c",
  "session_id": "sess_hash_91ab",
  "user_id_hash": "uh_4d20",
  "tenant_id": "tenant_a",
  "environment": "prod",
  "trace_id": "4bf92f3577b34da6a3ce929d0e0e4736",
  "span_id": "00f067aa0ba902b7",
  "mcp_server_name": "erp-ap",
  "tool_name": "list_review_queue",
  "latency_ms": 1840,
  "tool_execution_ms": 1610,
  "output_size_bytes": 18233,
  "retry_count": 1,
  "success": true,
  "argument_auto_corrected": false,
  "tool_chain_position": 2
}
Notice what is missing: no invoice numbers, no vendor names, no amounts, no query text.
Session and chain summaries
mcp.session.summary rolls a session into one row: total_tool_calls, successful_calls, failed_calls, session_duration_ms and unique_tools_used are required; token totals, total estimated cost, max_tool_depth and fallback_used are optional. Emit it on explicit session end and on inactivity timeout, or you will undercount every session that simply went quiet.
mcp.chain.summary covers one model response cycle: how many tool calls it made, in what order, how deep the nesting went, whether the chain completed, and how long it took. This is where you see that a user question about a job's committed cost took five calls when it should take two, or that a chain keeps dying at the same step. If you route requests through a gateway tool or capability layer, record which tool or capability each request resolved to as part of the chain; it is the data you need to tune tool routing.
Model and tool interaction signals
These fields are where telemetry stops being generic API monitoring and starts improving the agent. They feed tool schema design, prompt changes and model routing decisions.
| Field | Meaning | Where to detect it |
|---|---|---|
tool_required | The model indicated the tool call was mandatory | From the model request, if your client exposes it |
tool_hallucinated | The model called a tool that is not registered | The server or gateway, at dispatch. Record the attempted name in a hashed or allowlisted form |
argument_auto_corrected | The system repaired the model's arguments before running the call | Your validation or normalization layer, for example coercing a single item into a list or fixing a date format |
tool_response_used | The model actually referenced the tool's output in its answer | Hard to detect reliably; treat as a sampled, offline judgment |
tool_chain_position | Order of this call within the chain | The client or orchestrator |
chain_depth | Nesting level when tools call tools | The orchestrator |
Two of these deserve extra attention.
Argument auto-correction is a quiet tax. Every repair your server makes is a place where the tool's schema or description failed to tell the model what it wanted. If one tool's correction rate climbs, fix the schema: tighter types, clearer field descriptions, examples. Our servers normalize inputs before validating them (single items and lists both become one shape), and that kind of quiet repair is exactly what you should count, because it hides which tools confuse the model.
Hallucinated tool names tell you the model's picture of the toolset is wrong. Common causes: a tool was renamed, a description promises something another tool does, or a large catalog is being exposed where a gateway would serve better. The approach we describe in the MCP gateway pattern for construction APIs cuts this sharply, because the model picks from a handful of tools instead of hundreds.
Add your own workflow outcomes alongside these. If your server returns structured responses such as need_more_info, approval_required and policy_blocked, count them per tool. Repeated need_more_info on the same field means the agent's instructions are missing something, and approvals requested versus granted is the most honest measure of whether an agent is ready for more autonomy.
Privacy and compliance rules
Never log in the telemetry stream:
- Raw tool inputs.
- Raw tool outputs.
- Secrets, API keys and access or refresh tokens.
- Full prompts, unless gated and redacted under a specific policy.
- Personal data, unless encrypted and handled under your compliance rules.
Allowed:
- Payload hashes.
- Schema identifiers and schema hashes.
- Size metrics.
- Boolean flags.
- Classification labels, such as "contains financial data".
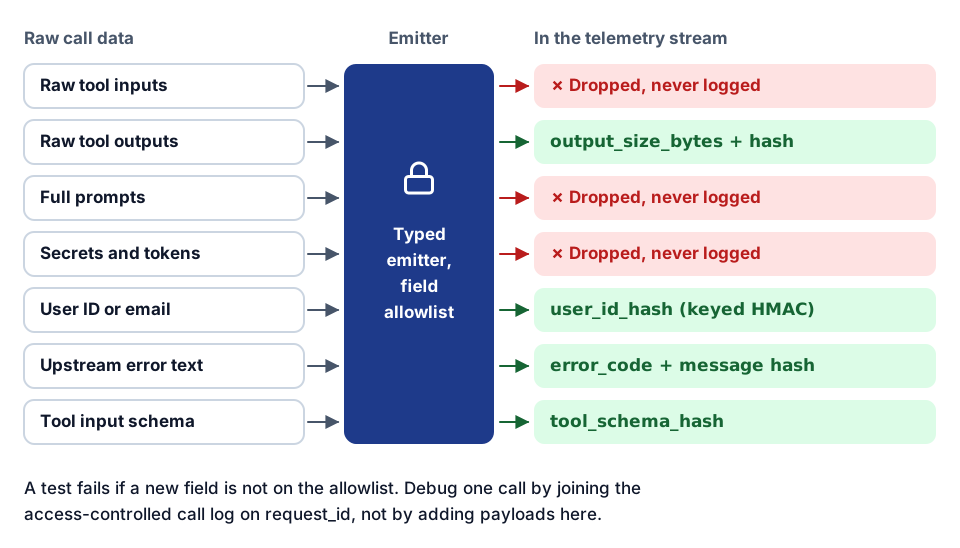 What crosses the emitter: sizes, hashes and codes, never payloads, prompts or secrets.
Three implementation details make the rules hold up:
- Use a keyed hash for user IDs. Email addresses and employee numbers are low-entropy. A plain SHA-256 of one can be reversed by hashing a list of likely values. Use an HMAC with a secret key held outside the telemetry pipeline, so analysts can count and join on
user_id_hashwithout being able to recover the person. - Hash error messages, keep error codes. Raw error text from upstream systems often echoes the request, including record values. The code tells you the category; the hash lets you group identical messages without storing them.
- Enforce it in code, not in a wiki. Build events with a typed emitter that only accepts approved fields, and add a test that fails if a new field is not on the allowlist. A redaction step at the collector is a good second line, not the first.
Retention: keep high-cardinality raw events for 30 to 90 days, aggregated metrics for 12 to 24 months, and audit logs for as long as your compliance requirements say.
For construction companies, the sensitive fields are often less obvious than names: invoice amounts, vendor bank details, payroll lines, bid numbers, and the contents of contracts and change orders. None of that belongs in a shared telemetry stream.
OpenTelemetry span structure
Map the events onto traces so one request can be followed from the model to the upstream API:
agent.turn                              (root: one user request)
└── model.inference                     (parent: the model call that chose tools)
    ├── mcp.tool_call  list_review_queue   (child: one span per tool call)
    │   ├── http.client  GET /invoices      (nested: external API call)
    │   └── http.client  GET /invoices?page=2
    └── mcp.tool_call  get_review_packet
        └── http.client  GET /invoices/{id}
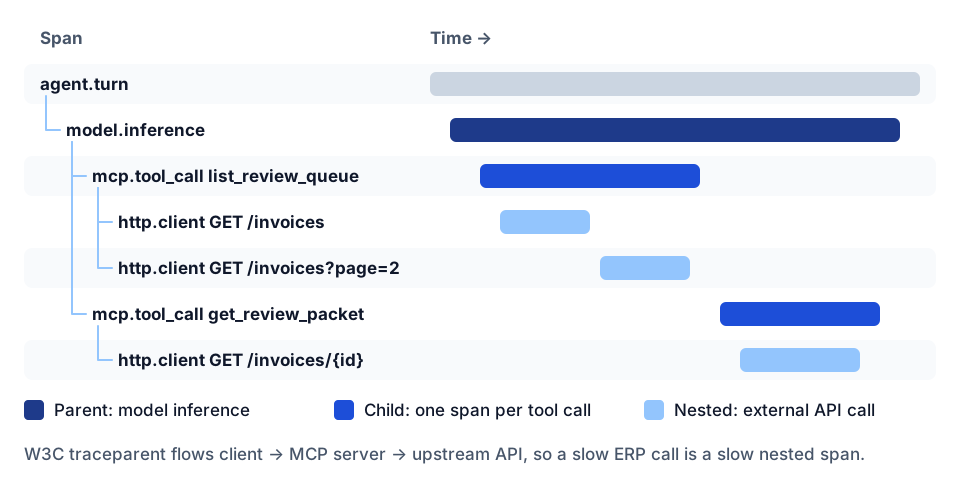 The span tree as a waterfall: inference, tool calls and nested API calls on one trace.
Guidelines:
- One span per tool call, carrying
request_id,mcp_server_name,tool_name, the outcome and the interaction flags as attributes. The events above can be emitted as span events or as separate log records that sharetrace_idandspan_id. - Propagate W3C trace context (
traceparent) from the client to the MCP server and from the server to the upstream API, so a slow ERP call shows up as a slow nested span rather than a mystery. - Parallel calls are siblings. Calls in the same
parallel_group_idshare a parent and overlap in time; the flame graph shows whether parallelism is actually saving time. - For streaming responses, one span per stream with events for progress, not a span per chunk.
- Keep high-cardinality values out of metric labels. User, session and request IDs belong on spans and logs, not on metrics.
OpenTelemetry also has semantic conventions for generative AI, still marked experimental at the time of writing, that include tool-call attributes. Map your field names onto them where they line up, and keep your own names where they do not.
Derived metrics
None of these are logged directly. Compute them downstream from the events.
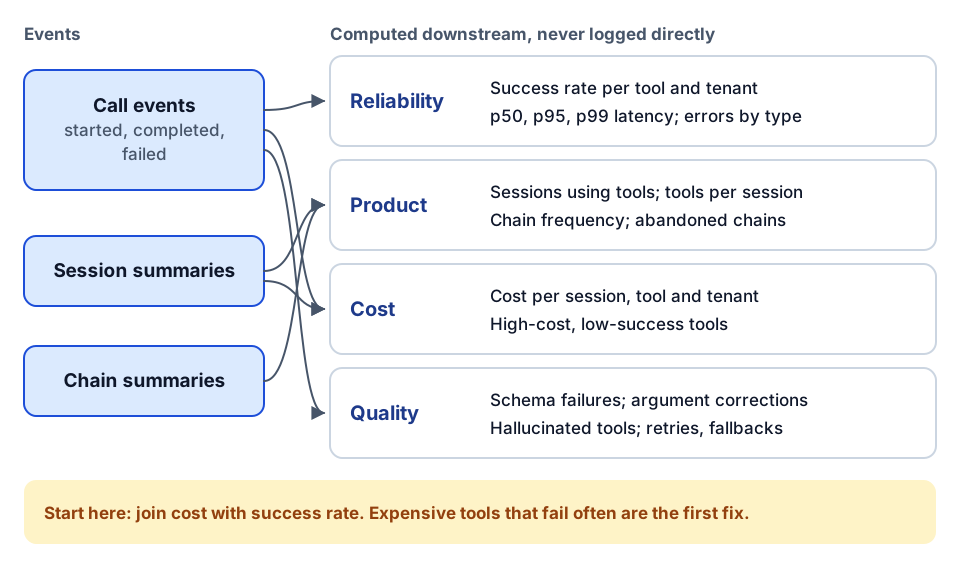 Four metric families computed downstream from three event sources.
| Family | Metric | Built from |
|---|---|---|
| Reliability | Tool success rate per tool and per tenant | completed / (completed + failed) |
| Reliability | p50, p95 and p99 latency | latency_ms on completed events |
| Reliability | Error rate by category; timeout frequency | error_type on failed events |
| Product | Share of sessions that invoke any tool | session summaries |
| Product | Average tools per session; tool adoption rate | session summaries, started events |
| Product | Tool chain frequency; abandoned chains | chain summaries |
| Cost | Cost per session, per tool, per tenant | estimated_cost_usd, token counts |
| Cost | High-cost, low-success tools | cost joined with success rate |
| Quality | Schema validation failure rate | input_schema_valid |
| Quality | Argument correction rate | argument_auto_corrected |
| Quality | Hallucinated tool rate | tool_hallucinated |
| Quality | Retry rate and fallback frequency per tool | retry_count, fallback_triggered |
The cost-and-quality join is the one that pays for the whole exercise. A tool that is expensive and fails often is your first fix. A tool that is cheap and never used is a candidate for removal, which also shrinks the catalog the model has to reason over.
Dashboards and alerts
Three dashboards cover most needs:
- Reliability: success rate heatmap by tool, p95 latency by tool, error category breakdown, timeout trend.
- Product: tool usage over time, top tools, average tools per session, chain visualization.
- Cost: cost per tenant, cost per tool, cost per successful outcome, high-cost failure analysis.
Add a fourth, smaller quality panel set for the agent team: auto-correction rate, hallucinated tool names, need_more_info by field, and approvals requested versus granted.
Alerts to start with:
- Error rate or p95 latency on a tool crosses a written threshold. On our Vista AP server, the rollback triggers for configuration canaries were an error rate above 5% or p95 latency above 4 seconds; set yours from a baseline.
- A burst of
authfailures, which usually means an expired secret or a misconfigured audience rather than an attack, but deserves a look either way. - A sustained rise in
rate_limitfailures against one upstream system, which often precedes the integration user being throttled or locked out. - Started events without terminal events, above a small baseline.
- Any new hallucinated tool name, or a jump in one tool's argument correction rate after a deploy. These are tickets, not pages.
Rolling it out
- Write the goals, non-goals and field allowlist and get infra, product and data to agree on them.
- Emit the three call events from the gateway or server, with the common fields and a typed emitter.
- Turn on tracing and make
trace_idandspan_idrequired. - Add session and chain summaries once call events are trustworthy.
- Add interaction signals, starting with hallucinated tools and auto-correction, because they are cheap to detect at the server.
- Build the dashboards, then the alerts, then review quality metrics weekly with whoever owns the agent's prompts and tool schemas.
If you run several MCP servers, emit from the gateway so every server gets the same events for free, then add server-specific detail inside the tool span.
Checklist
- Goals and non-goals written; non-goals include payload logging.
- Five event types defined, versioned and forward compatible.
- Every started event ends in exactly one completed or failed event.
- Common fields on every event, with keyed hashing for user IDs.
- No raw inputs, outputs, prompts, tokens or personal data in the stream, enforced by an allowlist test.
- Error types are a closed set; error messages are hashed.
- Traces run from model inference to tool call to external API, with context propagated.
- Reliability, product, cost and quality metrics computed downstream.
- Auto-correction and hallucinated tool rates reviewed after every tool or prompt change.
- Retention set for raw events, aggregates and audit logs.
Where to go next
- See a working gateway with per-call logging in the Tool Runtime MCP gateway article and on the Tool Runtime demo page.
- Put the server somewhere that can emit all of this with hosting streamable HTTP MCP servers, and harden it with hardening MCP servers for production.
- For approvals, audit trails and who is allowed to do what, read governing AI agents in construction, and see telemetry in the glossary.
- Want help instrumenting agents before they touch your ERP or project data? The AI readiness review is a fixed-scope place to start, or tell us what you are building.
Frequently asked questions
What should I log on every MCP tool call?
A started event and exactly one completed or failed event per call, each with a request ID, session ID, hashed user ID, environment, server and tool name, and trace IDs. Completed events add latency, size, retries and cost; failed events add a closed error type and whether the failure is retryable.
Should agent telemetry include tool inputs and outputs?
Not in the shared telemetry stream. Keep raw payloads in a separate, access-controlled call log for debugging and audit, and join the two on request ID. The telemetry stream should carry only hashes, sizes, schema identifiers and flags.
How do I structure OpenTelemetry spans for AI agents?
Make the model inference the parent span, each tool call a child span, and each external API call a nested span under the tool call. Propagate W3C trace context from the client through the MCP server to the upstream API, and keep user and session IDs on spans rather than metric labels.
What is a hallucinated tool call?
A call to a tool name that is not registered on the server. Count them at dispatch. A rising rate usually means a tool was renamed, descriptions overlap, or the model is choosing from too large a catalog.
How long should MCP telemetry be retained?
A common split is 30 to 90 days for high-cardinality raw events, 12 to 24 months for aggregated metrics, and audit logs for as long as your compliance requirements specify.
Next step
Have a workflow in mind?
Start with a readiness review: the task, the data and tools it needs, the access boundaries, and how a pilot would be evaluated.
Prefer email? charley@buildflows.ai
Get the next guide in your inbox
Field Notes: practical guides and new walkthroughs, about once a month.
Field Notes
Practical guides and new walkthroughs on construction data and automation, roughly monthly.
Keep learning

AI agents & MCP · April 29, 2026
MCP Gateway with Telemetry: How Tool Runtime Governs Agent Tools
Tool Runtime pulls many MCP servers into one governed endpoint. Here is how the gateway composes tools per API key, logs every call, and why production agents need this layer.
AI agents & MCP · October 9, 2026
Hardening MCP Servers for Production: A Checklist
A checklist-style guide to running MCP servers safely in front of ERPs and project platforms, covering auth modes, read-only defaults, write allowlists, approval handshakes, reliability controls, transport security, untrusted content, error envelopes, telemetry and hosting options.
AI agents & MCP · October 10, 2026
Hosting Streamable HTTP MCP: Kubernetes, Container Apps or a VM
A vendor-neutral guide to hosting streamable HTTP MCP servers: choosing a session posture, comparing Kubernetes, managed containers and a VM with nginx and systemd, and getting probes, Origin checks, OAuth 2.1, secrets, observability and load testing right.